
Introduction
Production readiness—or more specifically the production readiness review (PRR)—is a set of checks used to mark when software is considered secure, scalable, and reliable enough for use. While PRRs are unique to the engineering teams compiling them, most include things like adequate testing and security coverage, connection to CI/CD tools, and detailed rollback protocol.
Of course, the need for safe, scalable, and reliable systems doesn’t end at initial launch. Code and the standards governing it change, which means software needs to be regularly evaluated for alignment. While tools like code scanners and APMs make it easy to assess some indicators of software health, rapidly expanding software ecosystems make historically manual checks like ownership, on-call information, and SLOs much harder to maintain without sacrificing quality or time to market.
To better understand how teams are addressing new challenges in production readiness, Cortex conducted a survey of 50 engineering leaders at companies with more than 500 employees in North America, Europe, UK&I, and AsiaPac. The survey included free-text and multiple choice questions pertaining to production readiness standards, tools, struggles, and desired future state. This report contains an analysis of these results as well as suggestions for building or improving your own program.
Survey demographics


Key Themes
There are five key themes to unpack in the survey results, which reflect broader market trends and conversations.
1. Standards vary widely across and even within organizations.
While we expect to see variation in production readiness checklists by org size and industry, survey results actually show zero duplication; no two leaders selected the same set of standards from a choose-all-that-apply list. Additionally, when asked about obstacles to ensuring production readiness for new and existing software, the #1 response (66%) was lack of consistency in how standards are defined across teams within their own company.
2. Even the most confident leaders struggle with software ownership, manual follow-up, and on-going alignment to standards.
When asked about blockers to production readiness, 56% said manual follow-up, and 36% said unclear ownership. Even when just looking at those reporting the highest confidence in their program, these two options still tied for #1 pain (42% each). More than 30% of this cohort also reported struggling with continuous checks like ensuring adequate code coverage, and enforcing SLOs—highlighting a solution gap in continuous rather than point-in-time assessments.
3. A third of leaders surveyed report having no process for continually monitoring software for alignment to standards.
When asked about ensuring alignment to standards post-initial launch, 32% of engineering leaders confessed to having no formal process outside of addressing incidents. While still a relatively new technology, Internal Developer Portals (IDPs) now offer a way to centralize “always on” standards, which may be why the 25% of survey participants that have adopted IDPs also report higher confidence in their production readiness programs.
4. 98% have witnessed at least one negative consequence of failing to meet production readiness standards at their organization.
While overall program confidence hovers around 6/10, 98% of participants have witnessed at least one significant consequence of failing to meet production readiness standards, with top responses all relating to downstream loss in revenue or time to market. 62% saw an increase in change failure rate, 56% saw an increase in mean time to resolve/remediate, 54% saw a decrease in developer productivity, and 52% said they’ve seen software not ship on time.
5. Tooling used to track production readiness is more highly correlated with program confidence than the checks themselves.
While we see variation across production readiness lists, the top three checks are the same for the most and least confident cohorts—CI/CD integrations, connection to logging & monitoring tools, and peer review. So it may be that mode of management, rather than individual steps may be a better indicator of effectiveness. The most confident cohort are 4x less likely to use spreadsheets than the least confident, and 2x more likely than all participants to use IDPs.
The Production Readiness Review: Definitions, Composition, and Concerns
We asked survey participants to briefly describe what production readiness looks like at their organization, before inquiring about their confidence in this process, and what challenges they face.
How engineering leaders describe their production readiness process
While no two participants share the exact same process, survey results show clear trends in basic production readiness requirements:
67% mentioned testing and quality assurance process
The majority of respondents highlighted the importance of a thorough testing process, including unit tests, integration tests, and user acceptance tests, as part of their PRR. Ensuring code quality and meeting security standards were also frequently mentioned.
“We have a series of checks, for code quality, test coverage, etc. Then we deploy to a staging environment and perform load testing and scalability responsiveness. We also look at logging and alerting by killing the service and making sure alerts trigger. Then we do a dashboard and monitoring review. If all is good it can go to production using a standardized tool chain that logs each deploy.”
Sr. Engineering Manager @ 10,000+ person company
“Our Production Readiness Review consists of a couple of phases. Usually we will conduct UAT which functions as training. When that is complete we will rapidly fix release issues, and get sign-off. Then we will coordinate what rollback looks like for the team, and release into production.”
VP of Application Development @ 1,000-5,000 person company
50% mentioned automation and continuous integration/deployment
Many respondents are utilizing or aiming to integrate more automation into their PRR processes. This includes automated code reviews, setting up deployment pipelines, and monitoring systems to streamline the deployment process and reduce manual intervention.
“Our testing is largely automated, we run CI pipelines for all projects, and have upstream releases that are on the training system. They come out on a certain date regardless. Then we have integration testing rounds which identify cross product bugs and following a successful round, we will release the downstream or commercial version.”
Director, Field Engineering @ 1,000-5,000 person company
“We have a continuous integration process that includes security protocols like SAST and vulnerability scanning. Only if the software or code passes all the mandatory scanning steps will the binary be published to the repository manager. We have a CD in place which is controlled via a change management process with all the testing validations attached and only the approved changes are allowed to be deployed to prod.”
Engineering Lead @ 10,000+ person company
42% mentioned documentation, runbooks, and rollback protocol
A number of respondents emphasized the need for detailed documentation as part of the PRR process. This includes maintaining runbooks, deployment and rollback plans, and ensuring that all necessary documentation is up to date and accessible.
“We have a partly automated process that includes gated criteria, such as QA complete, code reviews, documentation reviews, infra assessment, monitoring & observability confirmation, operational readiness & training, and DR & rollback readiness. Once a change is identified, the Change Advisory board meets to ensure all the above gates are passed and then signs off the release. For hotfixes and smaller changes, a very slim version of the above process is used.”
Senior Vice President, Engineering @ 1,000-5,000 person company
“PRR involves an initial code review, testing, merge, and deploy to staging. After that, acceptance testing is done on the staging platform. When everything is clear, then code is deployed to production, it is also checked what would be the rollback in case of bugs in production. When deployed to production, monitoring is done on the deployed code and also this entire process is documented.”
Software Engineering Lead @ 1,000-5,000 person company
Composition of production readiness checklists
Survey participants were asked to select all items included in their standard production readiness checklist (or add others). Additionally, they were asked to identify which were challenging to enforce.
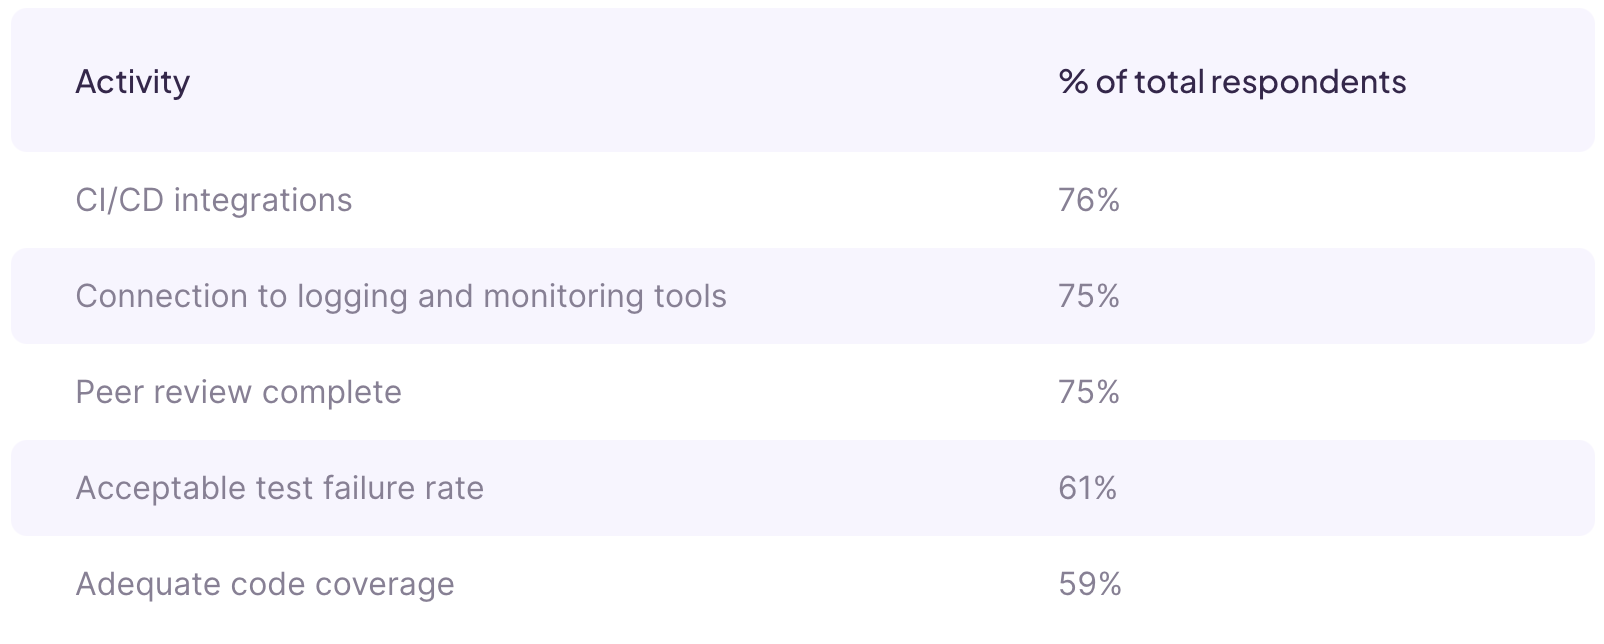
Most frequently cited requirements
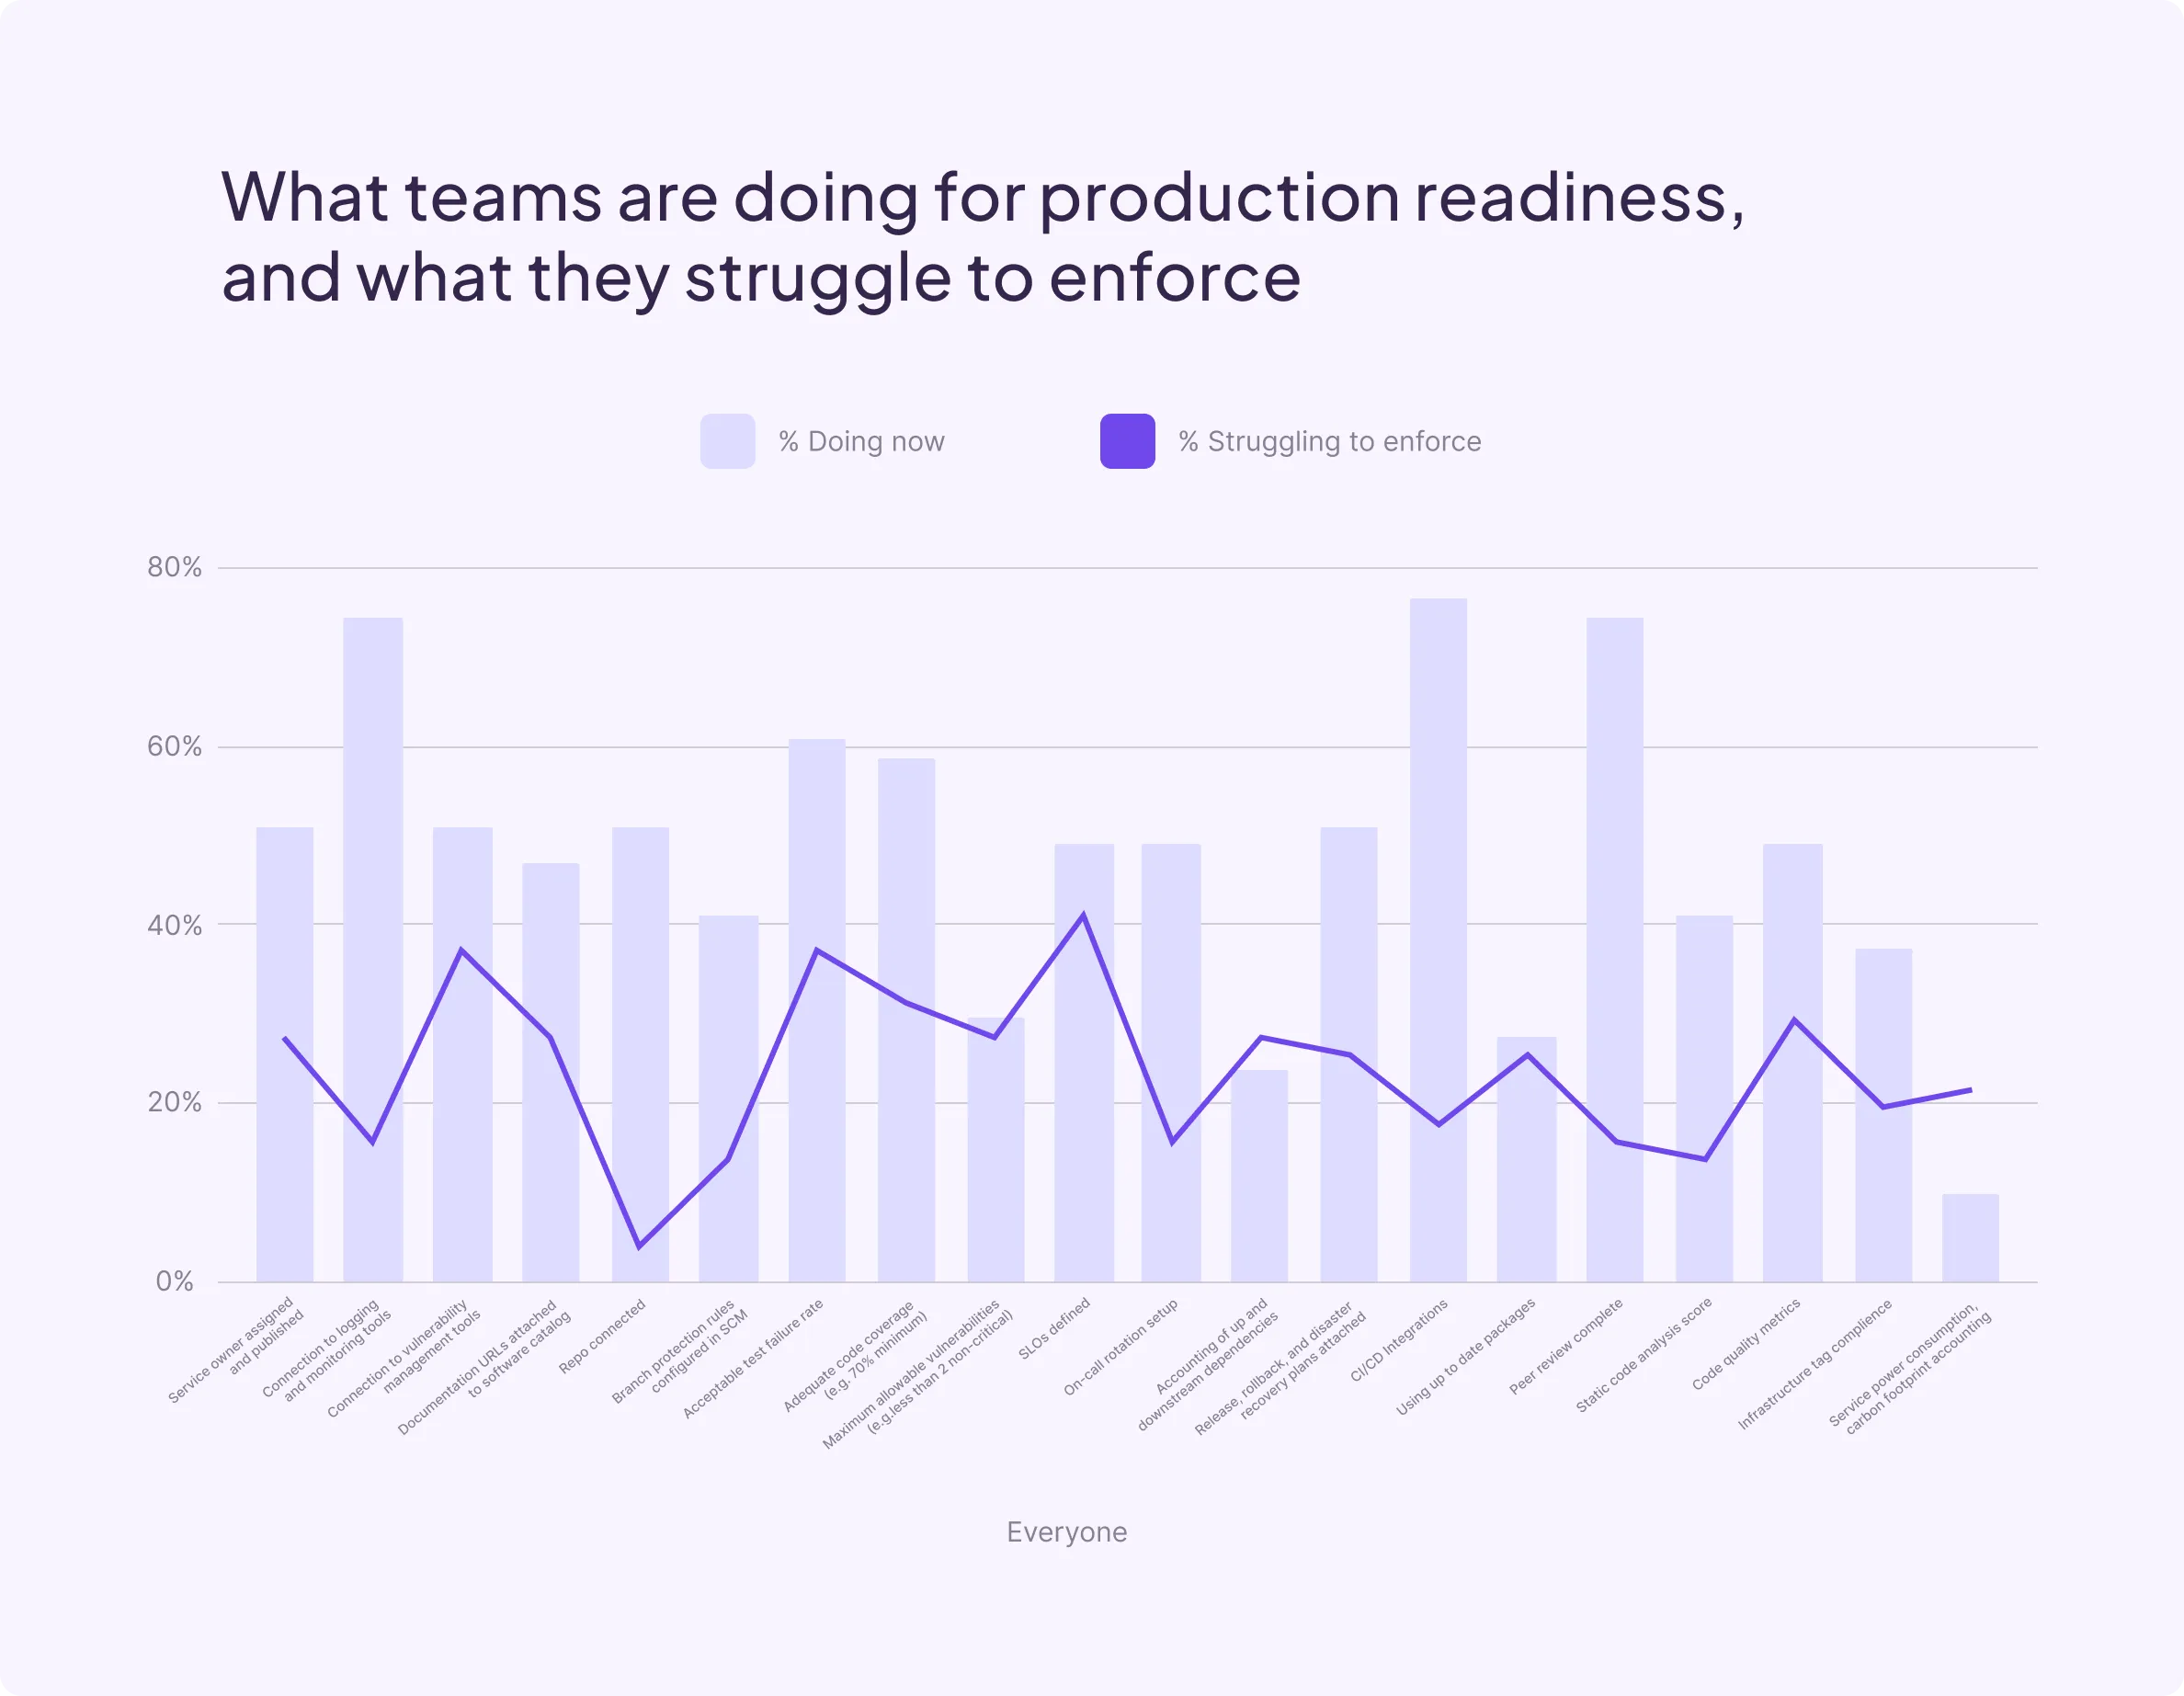
The most frequently cited checks in production readiness reviews include things that are typically automated or achieved by default in the software development process, like connection to a git repo, and integration with CI/CD tools. Other frequently cited items have close association with security or reliability, like testing and code coverage.
Most frequently cited production readiness activities
Most challenging areas to enforce
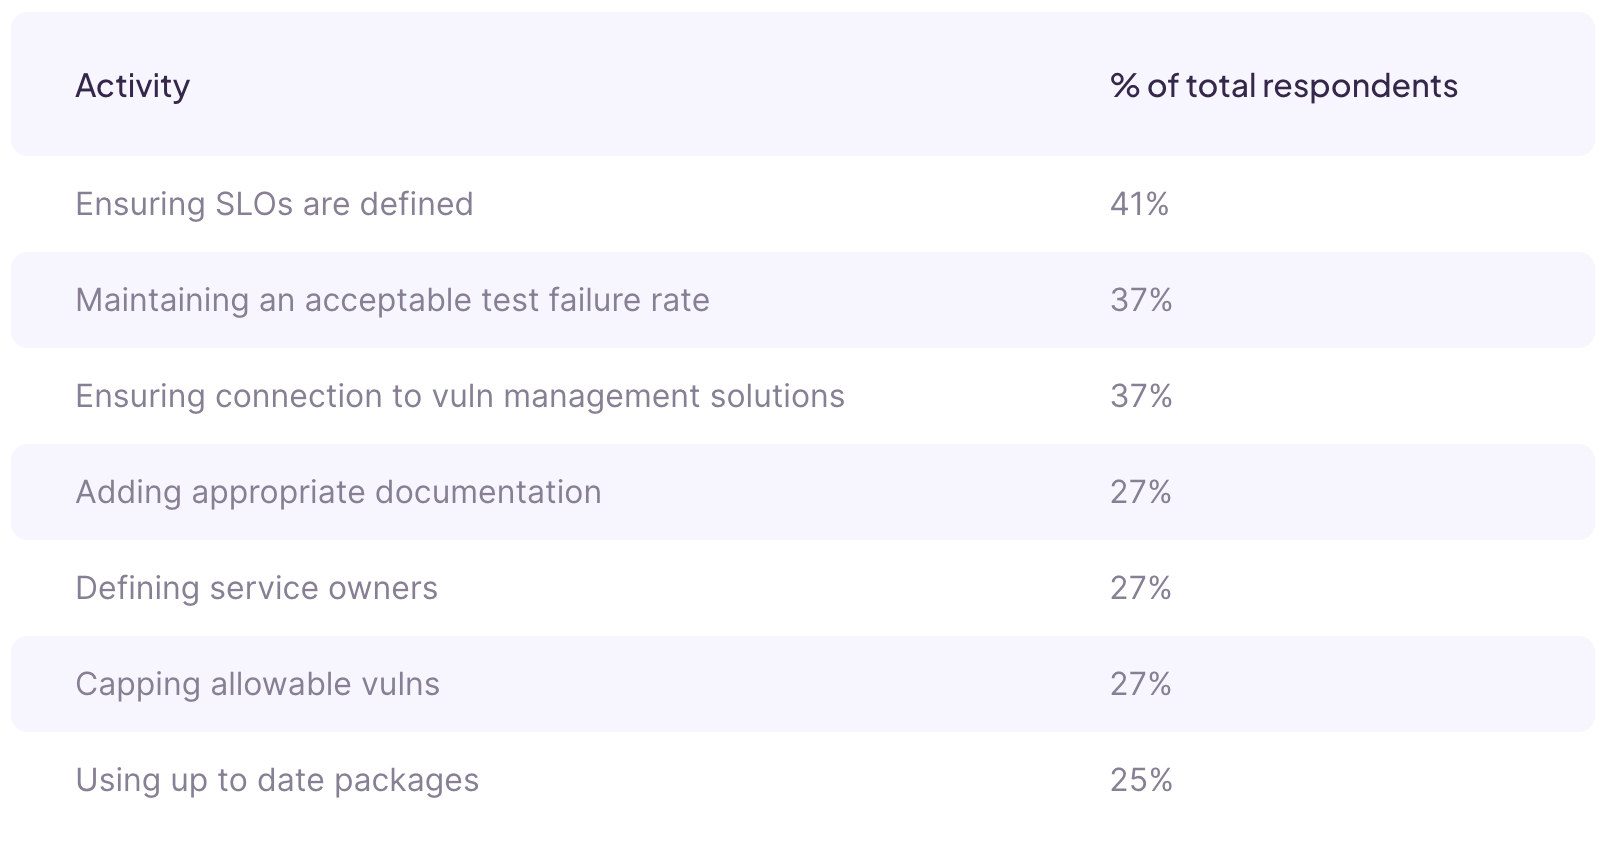
Both before and after initial push to production, organizations report struggling to enforce quite a few steps in their production readiness checklist. Topping the list are items that have historically not been easy to observe on a continuous basis without manual intervention, or those that are often omitted from the preliminary launch process because they require some observation time, like runbooks and SLOs.
Activities noted as challenging to enforce before and after production
Tools used to manage production readiness
The production readiness process spans multiple tools and teams. It’s therefore critical to centralize this information in order to ensure consistency of terms and timelines. We asked survey participants where their organization tracks alignment to production readiness standards. Participants could choose multiple answers if their organization uses multiple tools for this work.
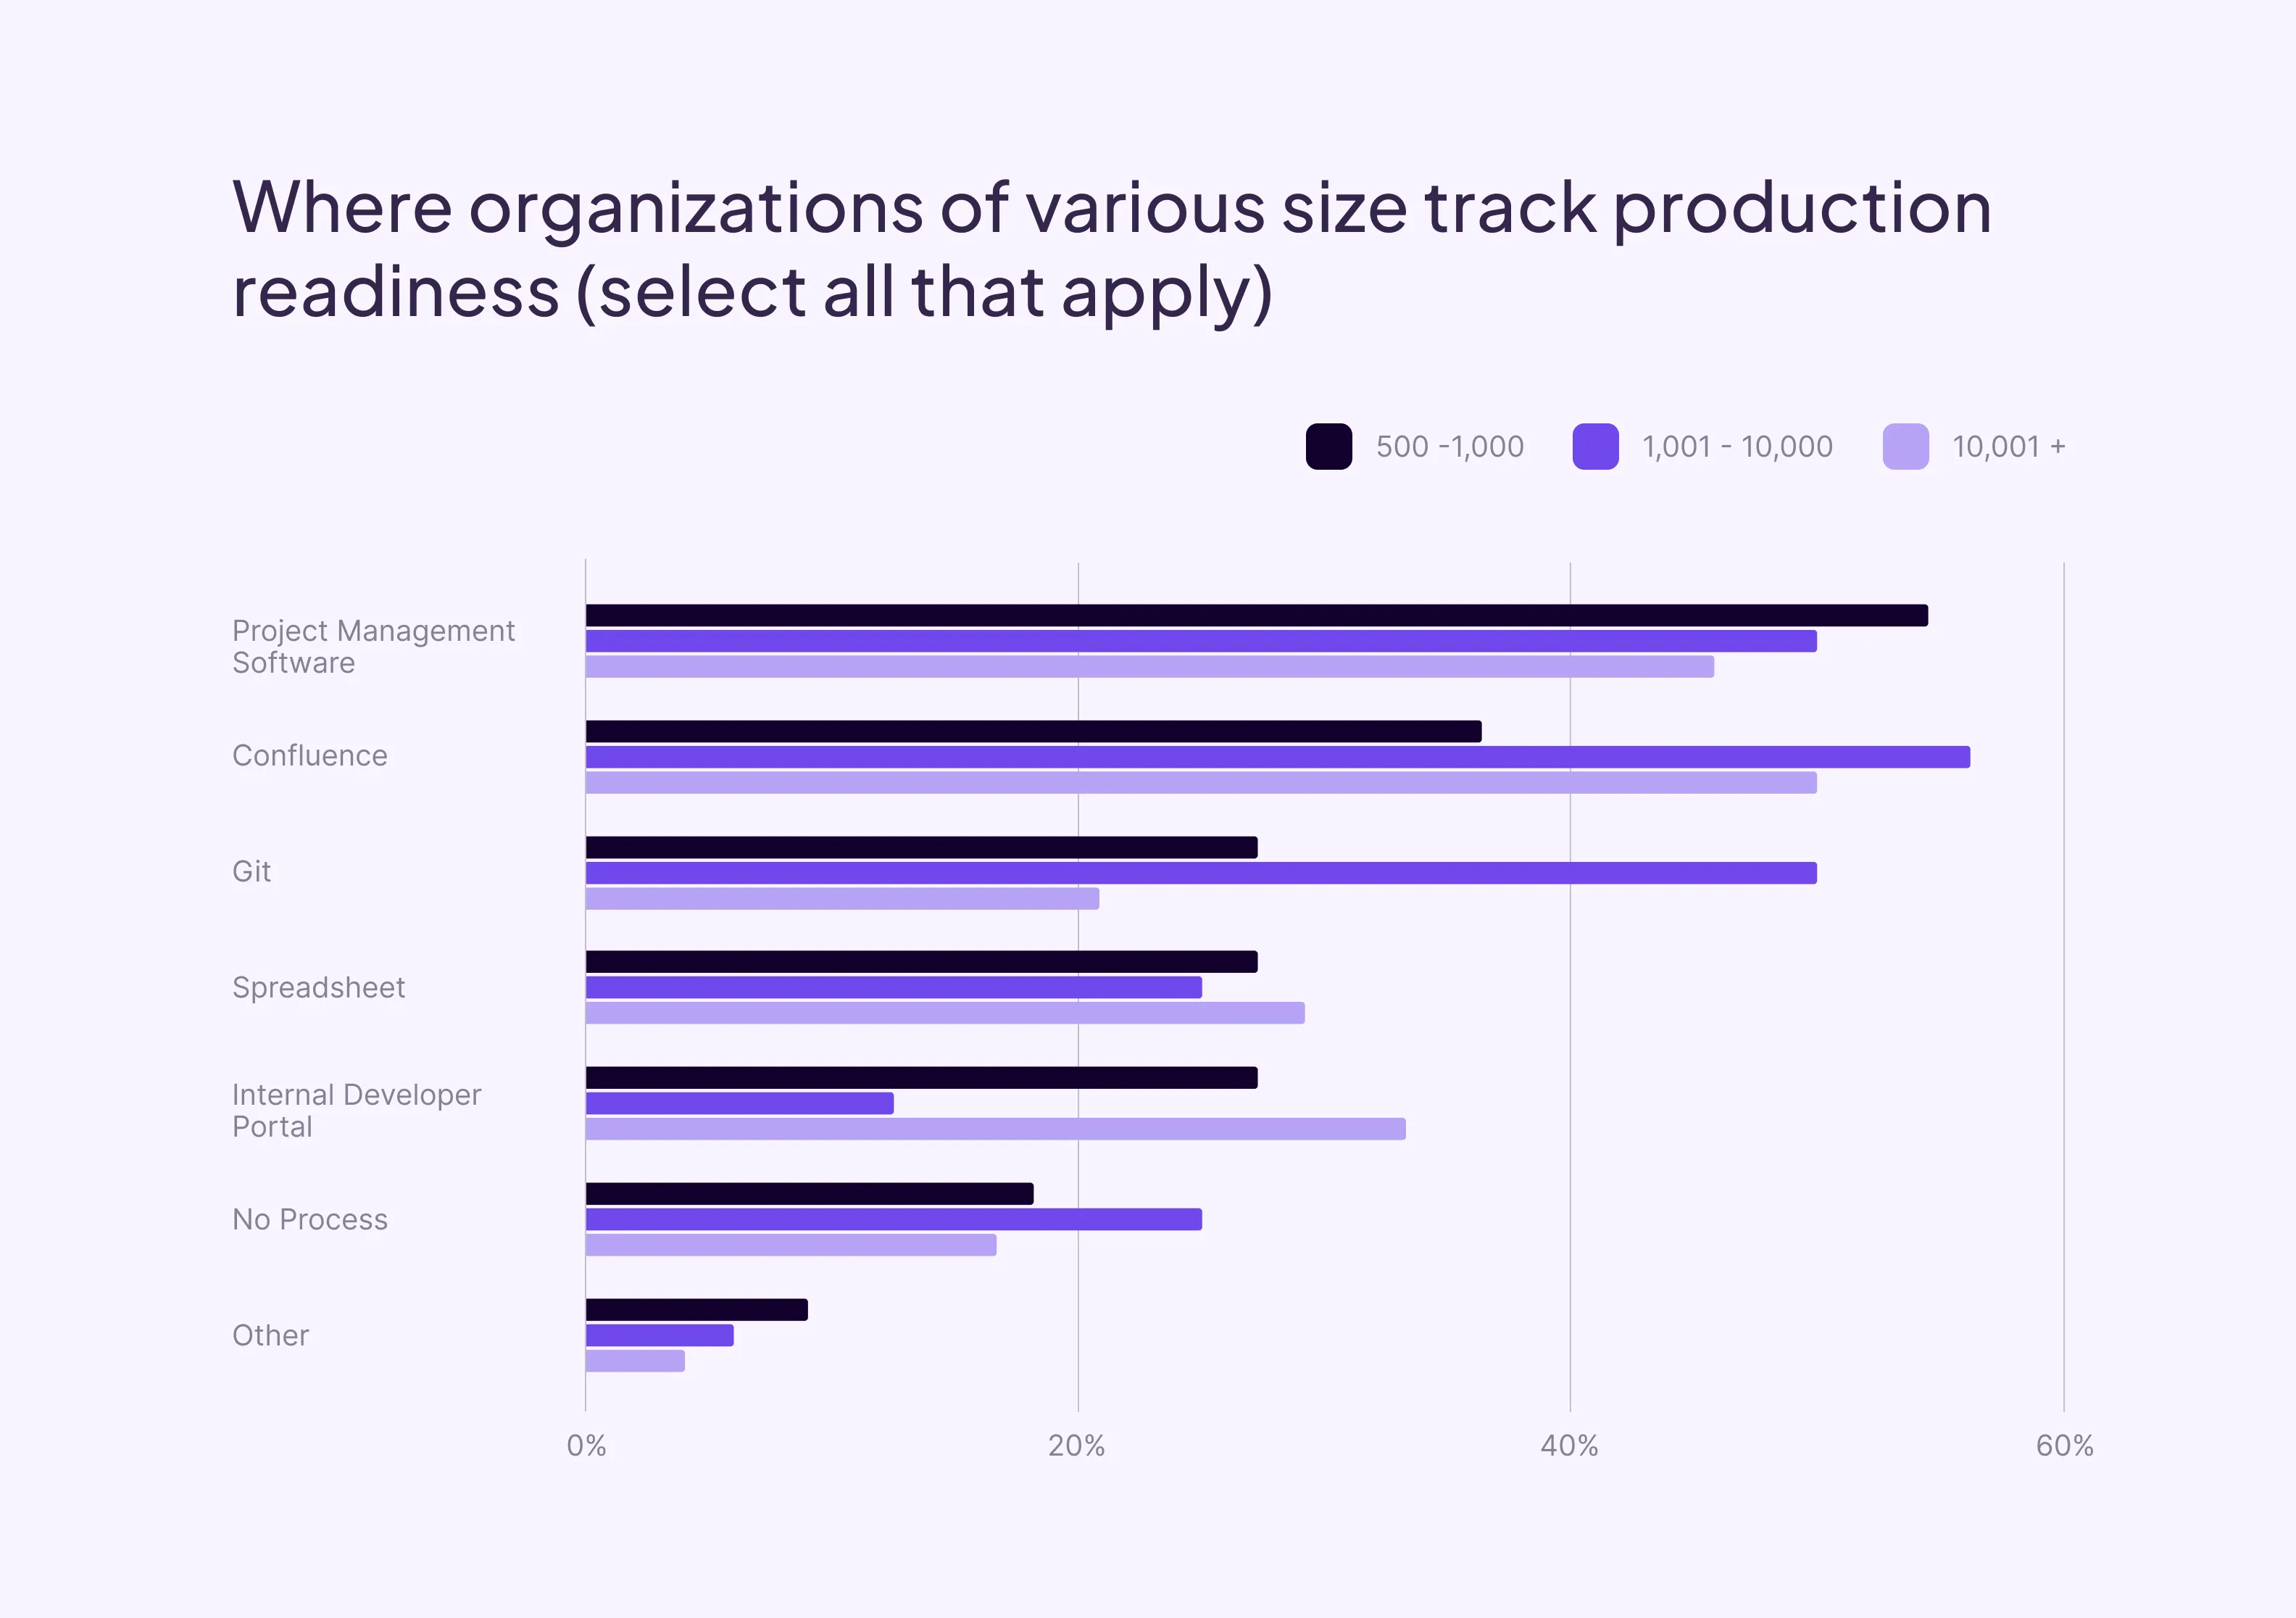
Interestingly, results do not vary significantly by organization size, though larger organizations are slightly more likely to use Internal Developer Portals, and smaller organizations are more likely either have no process, or use project management software. Project management software is still a popular choice for companies of all sizes, possibly due to the rise in software engineering-specific project management tools. However, we’ll see later that perceived program effectiveness tends to be lower for those only attempting to use project management software to track on-going alignment to standards.
Frequency of assessing production readiness
Production readiness is—perhaps mistakenly or short-sightedly—often framed as whether software is ready for initial launch. This is especially true for organizations that lack technology that can provide continuous assessment. We asked survey respondents how often they review software for alignment to standards like persistent ownership, and up-to-date packages after initial release into production.

Across all respondents we see an alarming 32% have no formal process for reviewing software outside of mitigating issues that may arise. Of those that do have a process in place, once a quarter is most popular (27%), with the next most cited interval actually being continuous (16%). Larger organizations are more likely to review more frequently, but they’re also more likely to employ Internal Developer Portals, which often provide this capability.
Challenges in tracking production readiness
As illustrated in the section above, ideal production readiness can be difficult to both achieve in full, and track in perpetuity. We asked participants what made this process difficult.

Results show that the #1 blocker to ensuring production readiness is lack of consistent standards across teams. Runners up on the list of challenges include manual follow-up for actions required, inconsistent ownership information, and lack of templates for building new software according to standards.
Cross-referencing tools by problems faced, we can draw a few connections. While spreadsheets and wikis can help track information about software, they require manual effort to reflect up to date ownership and status. While project management tools can automate prioritization and follow-up, they lack the integrations needed to continually assess when either are necessary.
Consequences of failing to meet production readiness standards
Failing to meet production readiness standards as code evolves can have negative consequences like higher risk from unmitigated vulnerabilities, or delayed time to market. We asked our survey participants which negative consequences—if any—they’ve witnessed at their current organization.
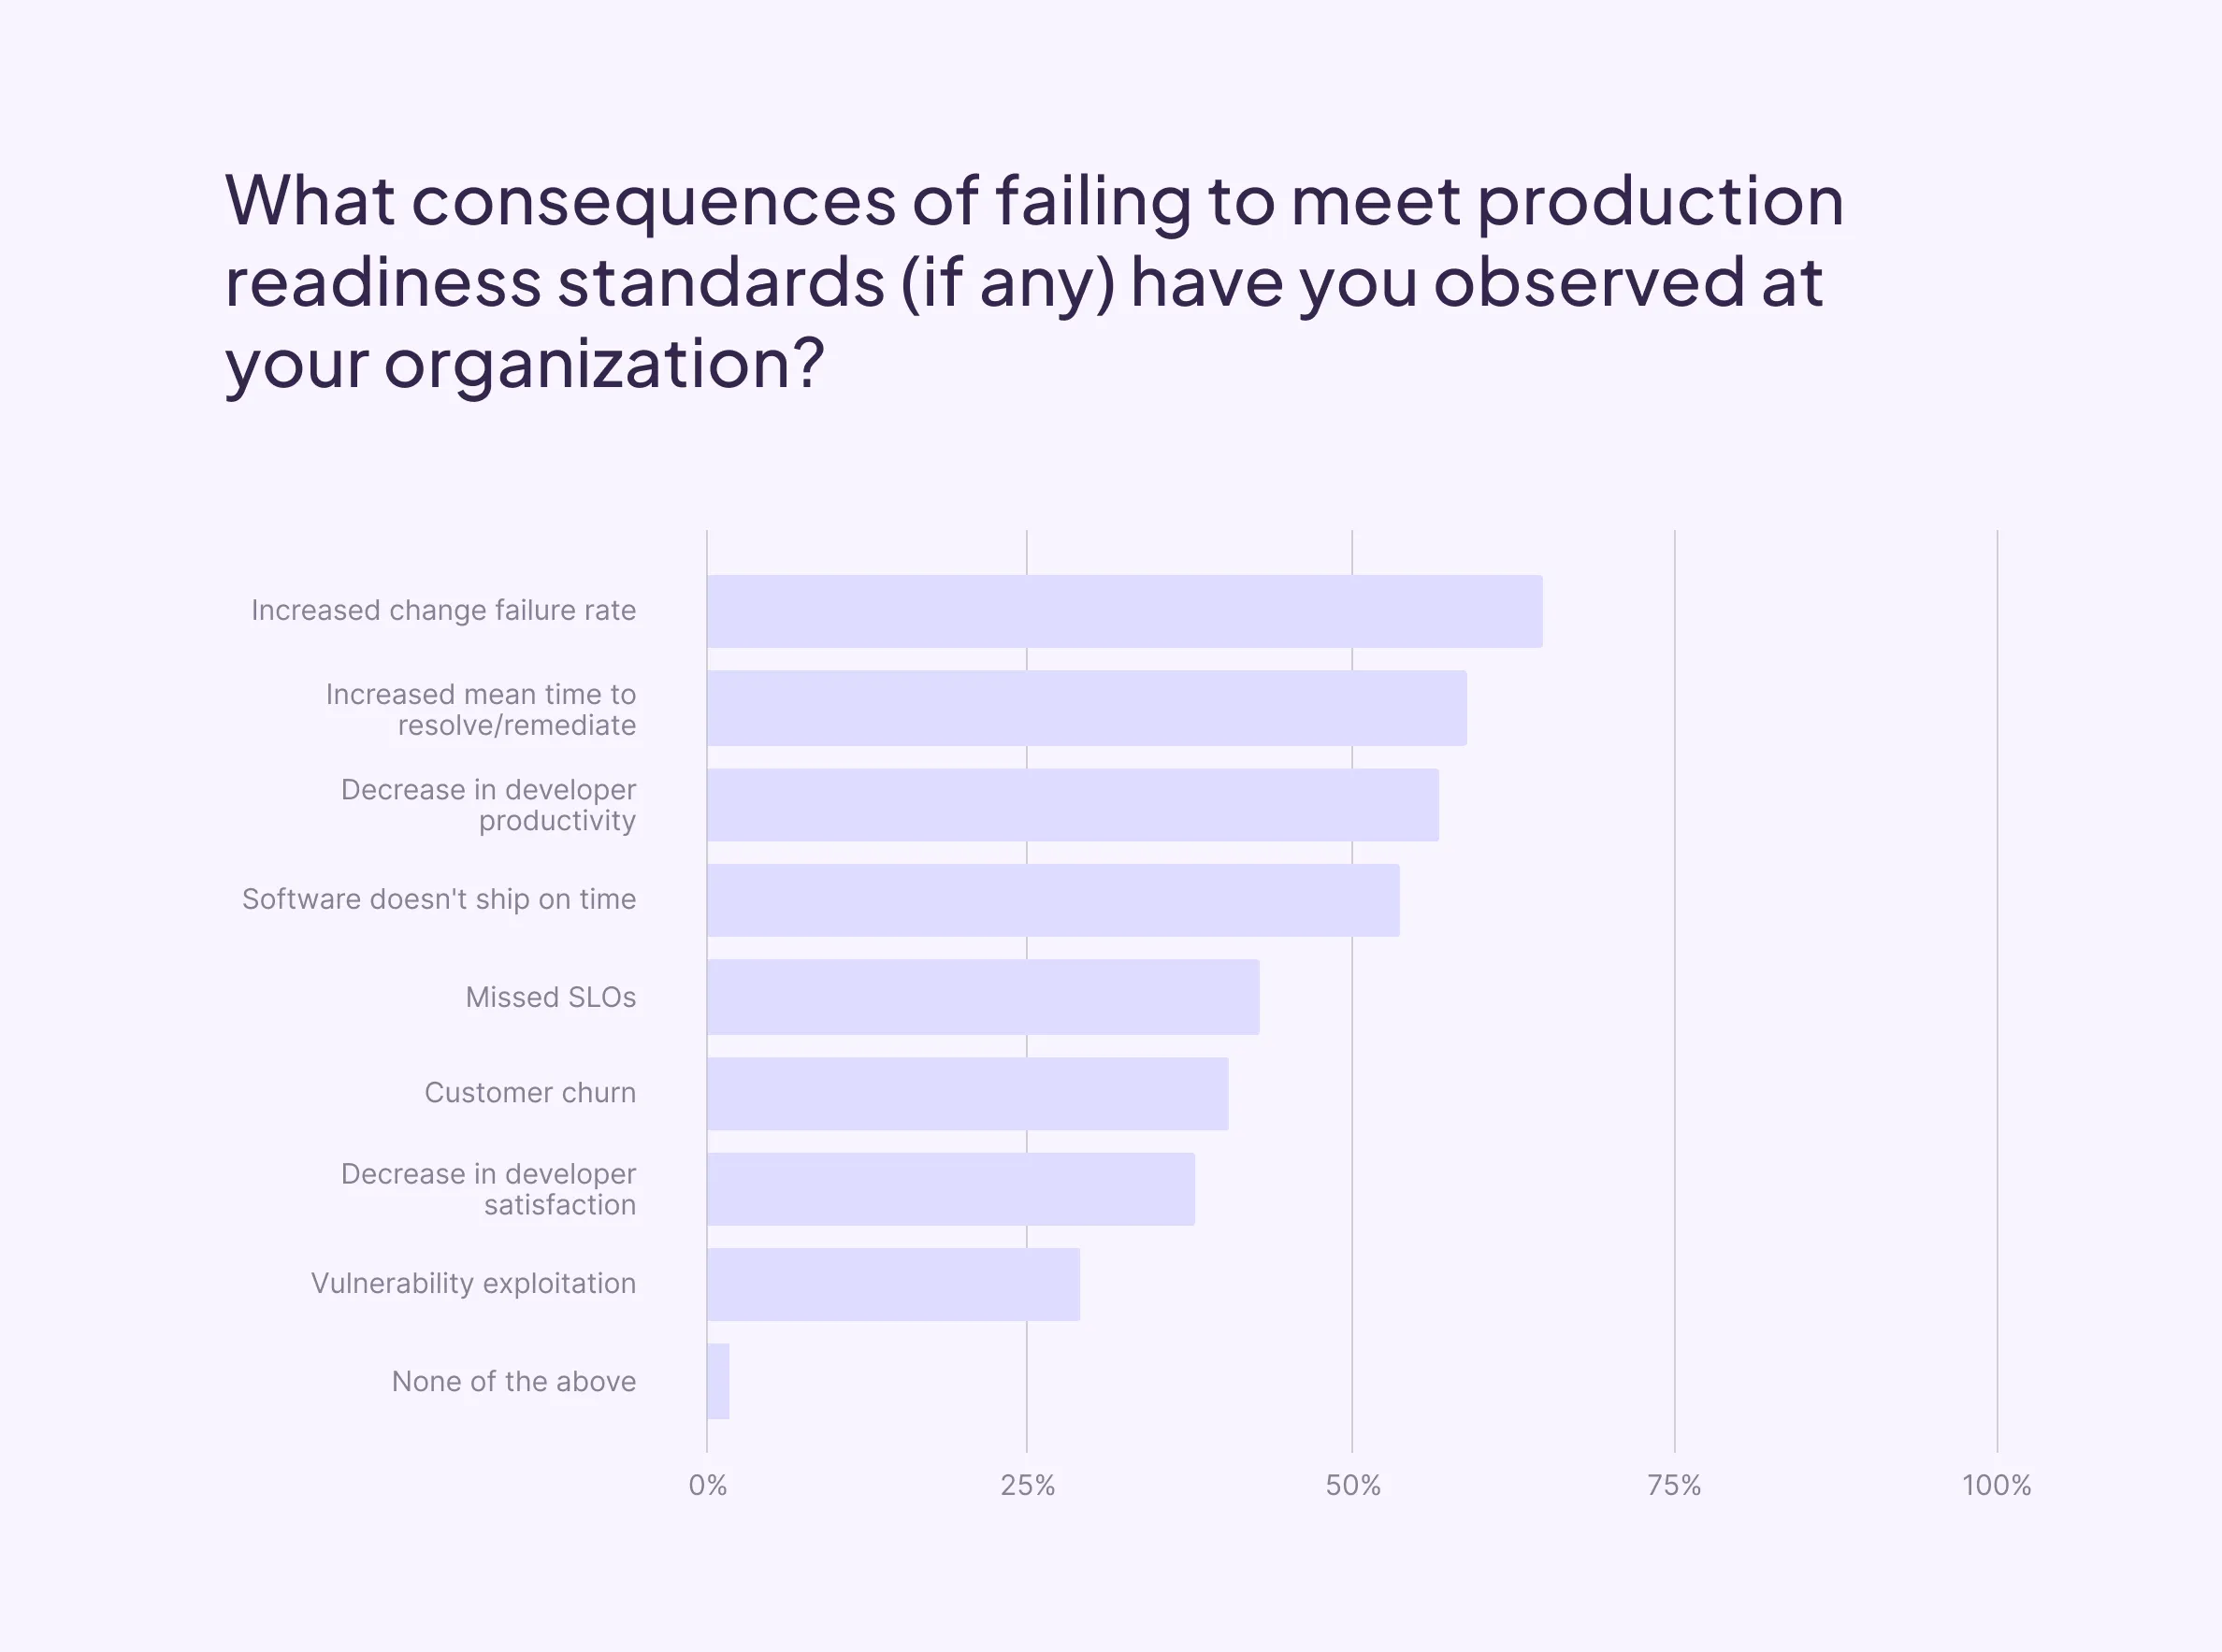
The most frequently reported consequences were those that could have a direct downstream impact on organizational revenue and time to market goals. 62% saw an increase in change failure rate, 56% saw an increase in mean time to resolve/remediate, 54% saw a decrease in developer productivity, and 52% said they’ve seen software not ship on time. When looking at the same data sliced by frequency of evaluations, we see that 94% of those without a process for on-going evaluation saw change-failure rate go up, compared to just 38% for those employing continuous assessment.
Vulnerabilities can’t be completely avoided with even the best production readiness checklist, but ensuring connection to vuln scanners, and setting timeline expectations for remediation can significantly reduce risk. While exploitation is a rare worst case scenario for languishing vulnerabilities, a surprising 22% of respondents reported witnessing this as a consequence of untimely response.
Trends by confidence: Comparing program characteristics by perceived effectiveness
Just looking at how various organizations structure their production readiness programs can’t tell us much about the effectiveness of their program. Afterall, the longest checklist doesn’t necessarily make it the most well-managed. To add a little more color to these responses, we asked leaders to rate the perceived effectiveness of their program on a scale of 1-10, with 10 denoting they “strongly agree” that their production readiness review process is “highly effective.”
The average confidence rating landed at 6.4, with confidence by org size and industry fairly uniform. The highest average confidence level reported by any sector was 7.5 (Advertising), with the lowest average confidence level for any sector coming in at 5.6 (Ecommerce), though it’s important to note that the sample sizes for both were relatively small. By far the more interesting trends were uncovered when comparing confidence to areas of concern, challenges in enforcement, tools used to manage production readiness, and the frequency at which it is assessed.
Program confidence x Production readiness checklists
Teams with the highest confidence (those reporting an 8, 9, or 10 on the effectiveness scale), exhibit similar trends to the wider audience in terms of activities that comprise their production readiness checklist, but diverge in which activities cause them the most trouble to enforce.
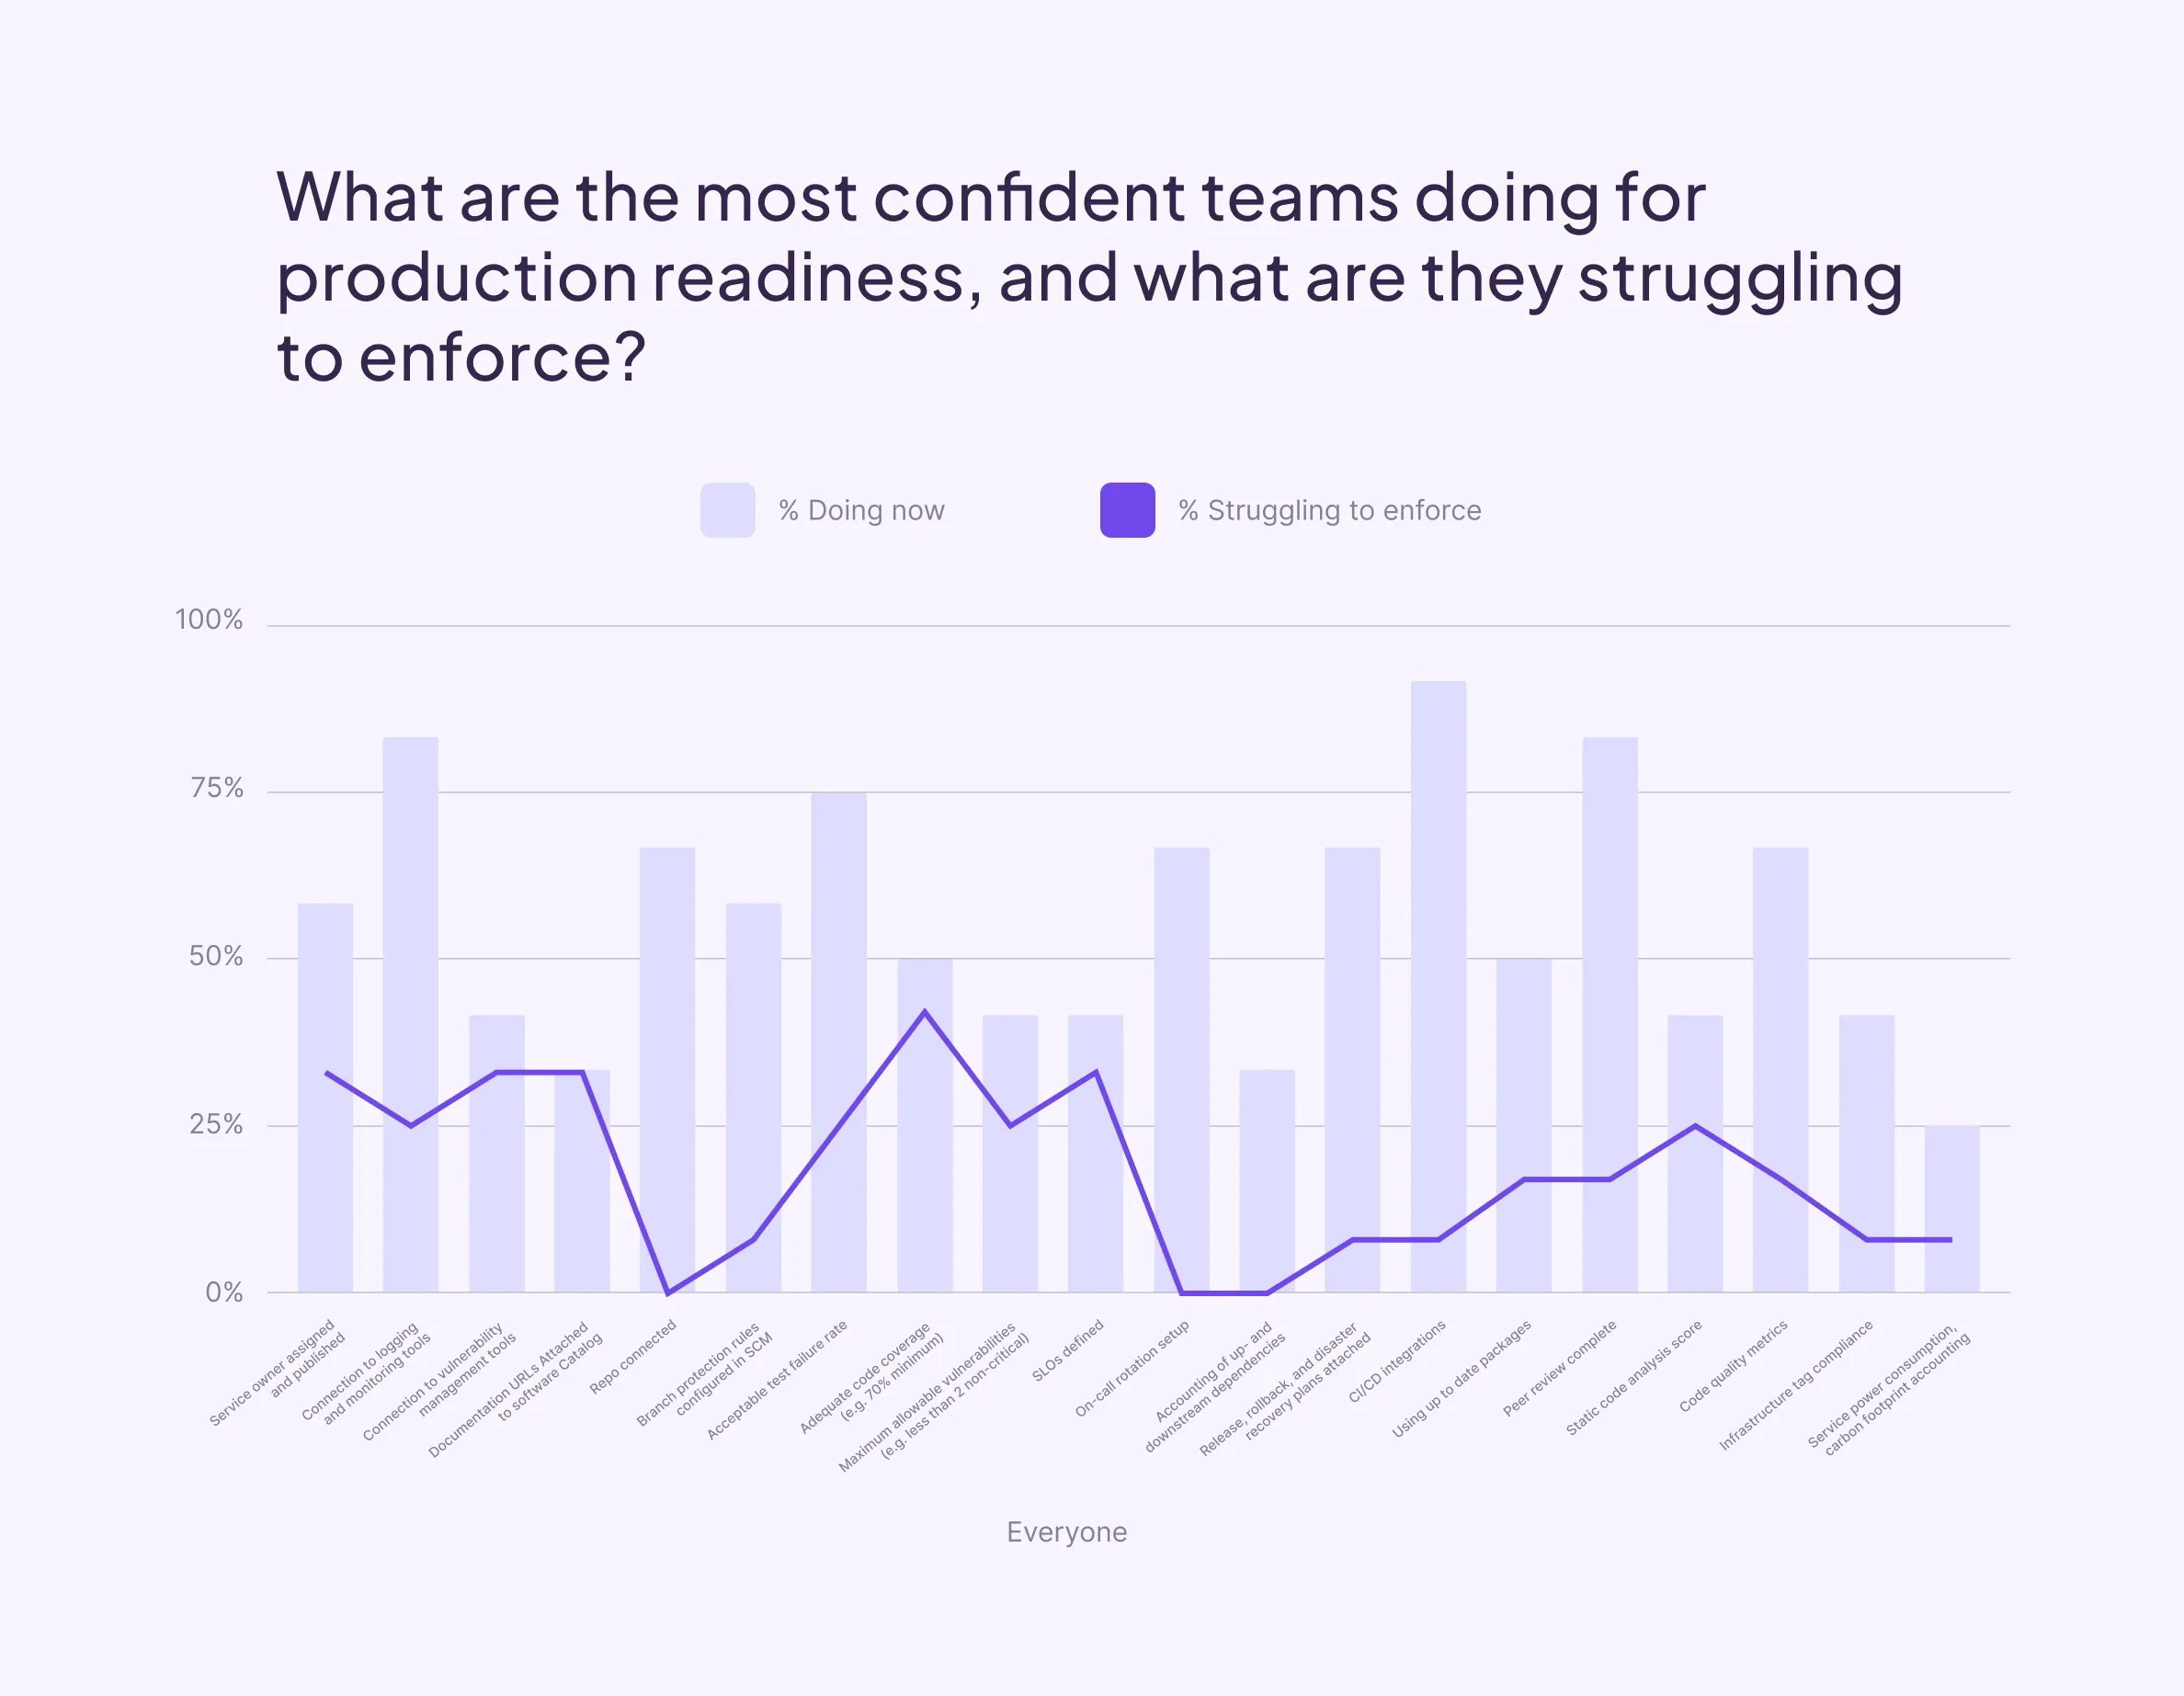
Compared to the general population, the most confident cohort does not report struggling with code quality metrics, on-call setup, or accounting of dependencies. This may be due to use of additional tools that specialize in each of those activities. However, more than 30% of the most confident cohort does still struggle with ensuring ownership is assigned, ensuring documentation is attached, ensuring adequate code coverage, maintaining connection to vulnerability tools, and enforcing SLOs. Importantly, these activities undergo more continuous change than the activities mentioned earlier. Without technology designed to enforce both point-in-time and continuous standards, all organizations will struggle with these checks.
Program confidence x Tools for tracking production readiness
When we compare program confidence to where teams track alignment to production readiness, we see that 75% of the least confident leaders (those providing a 1, 2, or 3 score), are using spreadsheets as part of their production readiness review, compared to just 17% of the most confident. Conversely, 50% of the most confident teams use an Internal Developer Portal, while 0% of the least confident do. Unsurprisingly, no one in the most confident cohort lacks a process for managing production readiness.

Program confidence x Frequency of assessment
When we look at program confidence by how often teams perform production readiness assessments, we see a few interesting correlations.
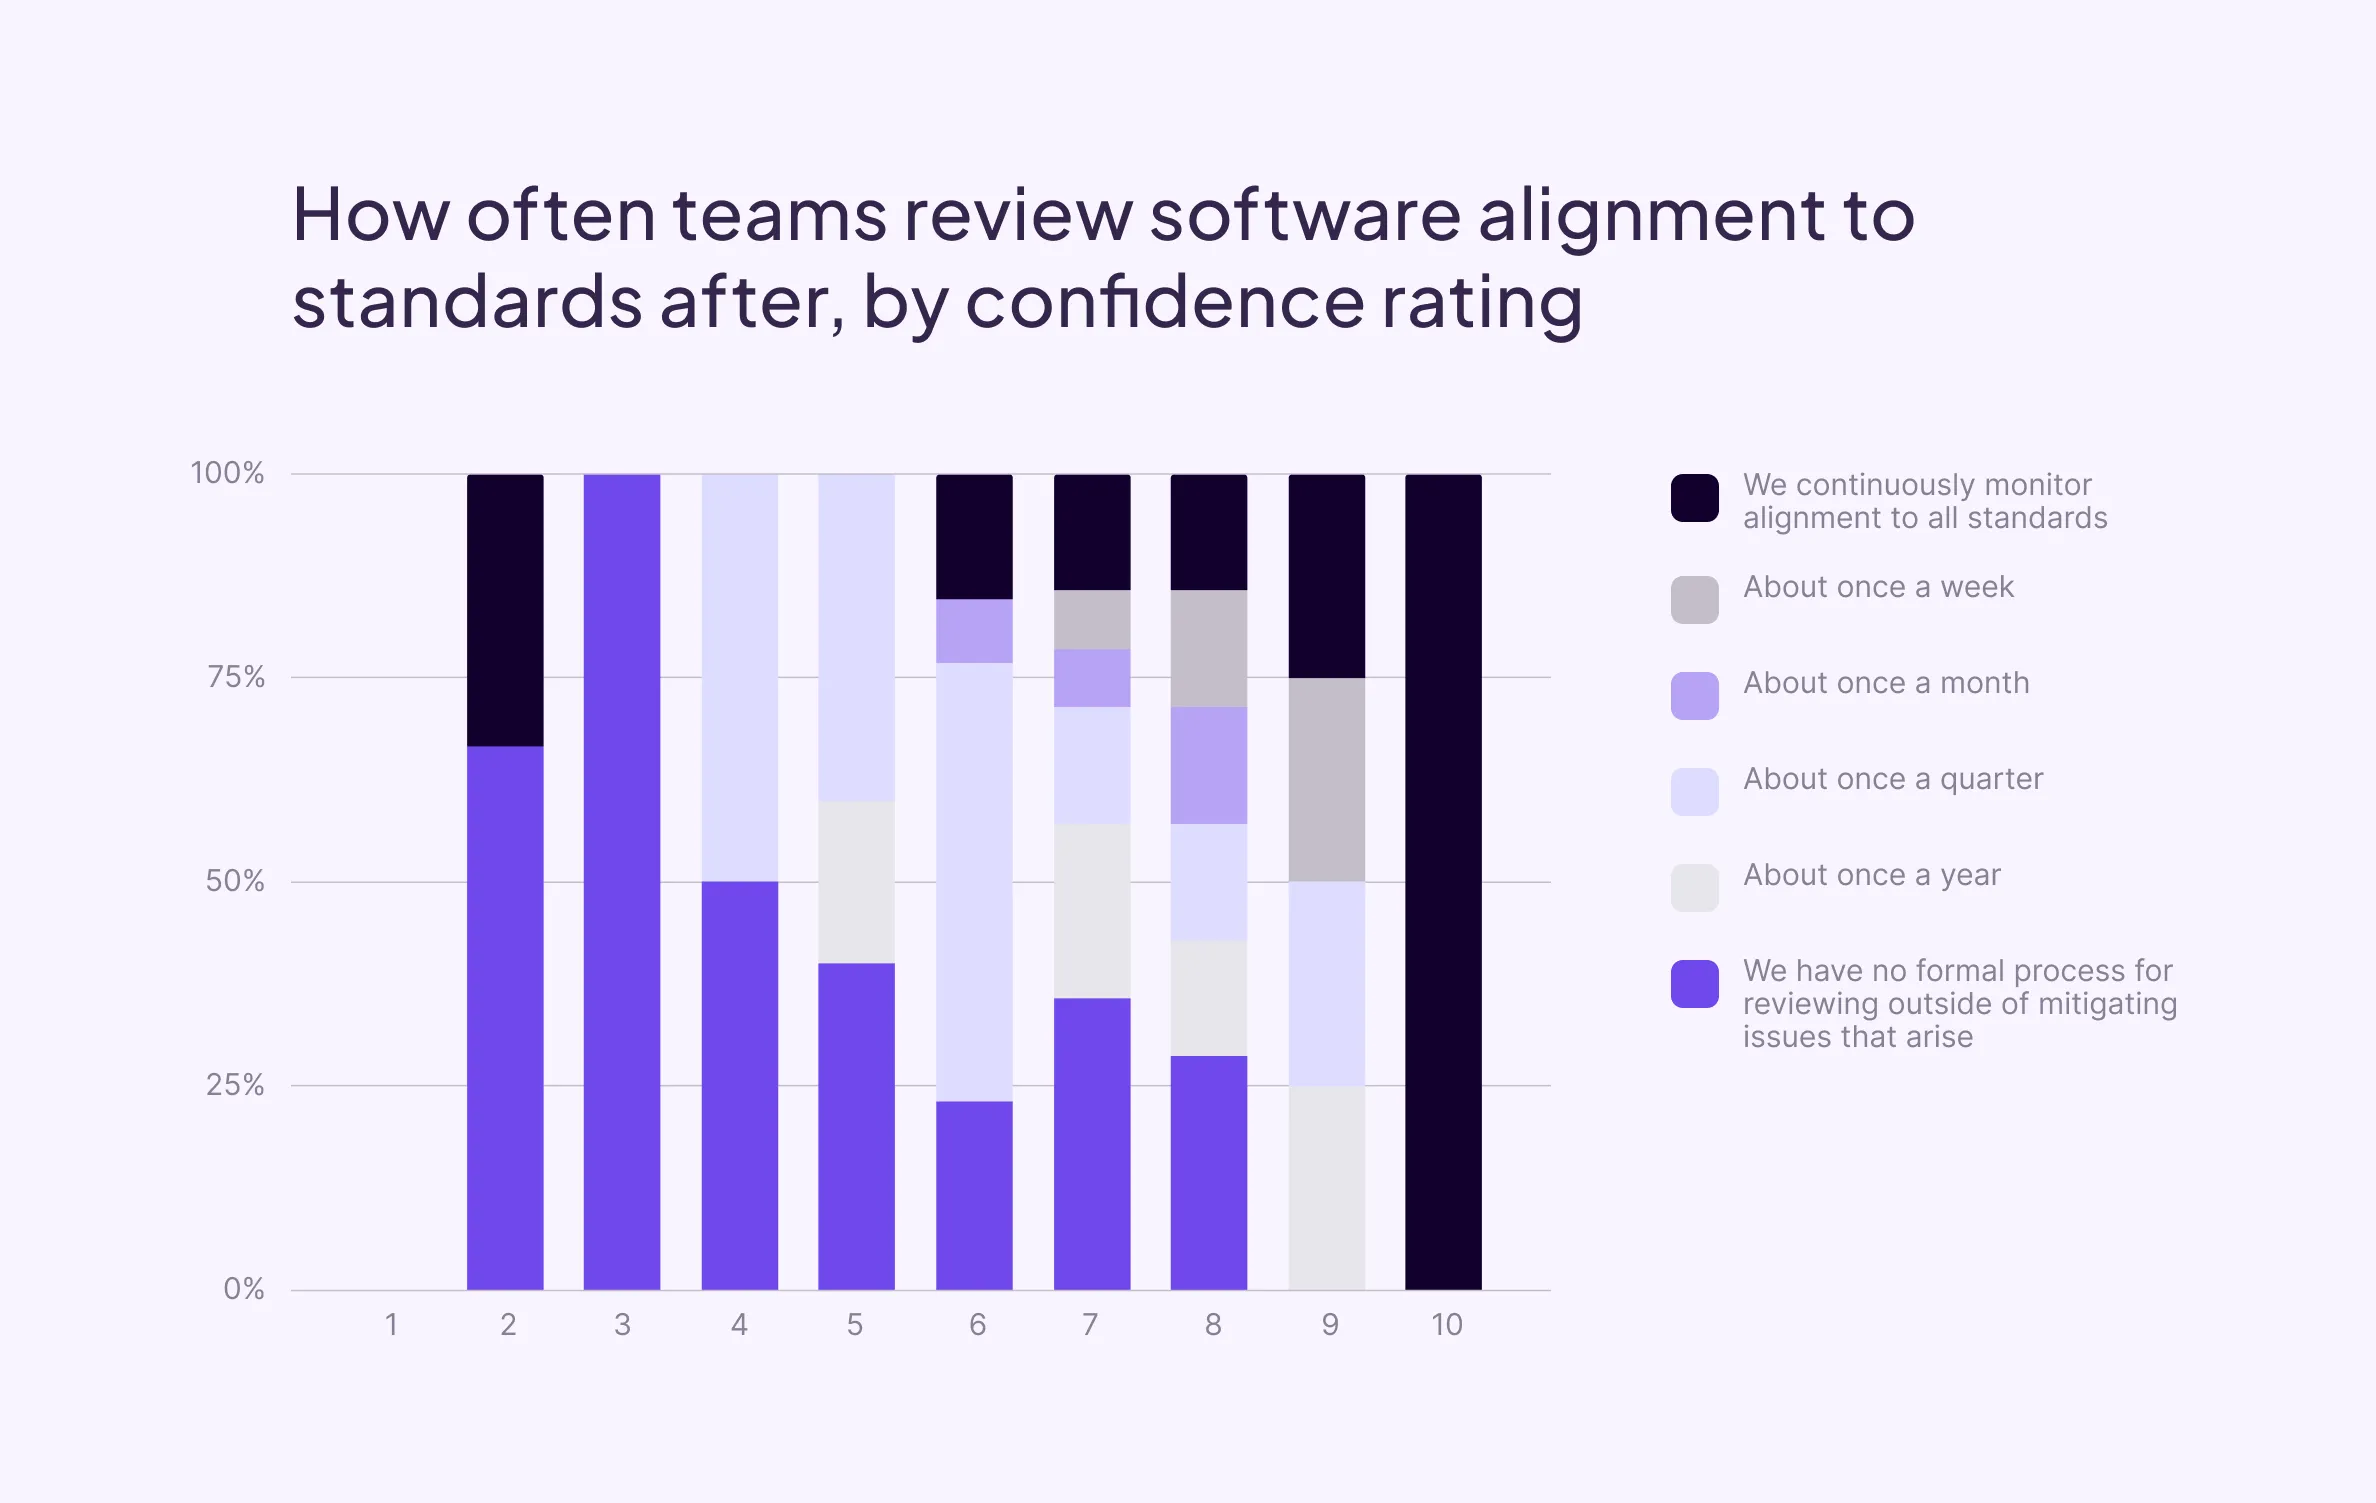
First, those that employ continuous monitoring report higher confidence than others (median of 7). Second, 83% of those reporting an 8 or higher confidence score employ some form of regular monitoring. And third, those reporting no formal process have a wider range of confidence than all others.
While we don’t know what contributed to each leader’s rating, if this last cohort believes regular reviews require more effort than they provide in upside, they may be less likely to consider lack of post-deployment reviews detrimental to program effectinvess. This may be particularly true of leaders that have not yet adopted ways to abstract away manual effort in ensuring alignment.
Program confidence x Challenges
When looking at program confidence by challenges faced when trying to employ standards of production readiness, we see the least confident leaders struggle most with lack of consistent standards. Interestingly, all leaders—regardless of program confidence—struggle with tracking ownership, and ensuring follow-up on actions required. In fact, these two challenges show the smallest difference between the most and least confident cohorts.

Universal problems like these tend to be indicative of a tooling—rather than people or process—gap. We now have Internal Developer Portals to help, but these solutions must include capabilities that make it easy to automatically refresh information about owners and health, continually assess alignment to standards, and automatically serve notifications for action required.
Production Readiness automation
We know that production readiness needs to be a continuous process, but lack of appropriate tooling can make that difficult to achieve—as exemplified by many of the responses in this survey. So we asked our survey participants which parts on the production readiness lifecycle should be automated.
While responses trended into four key buckets outlined below, a few participants noted that the bigger issue was a need for a more holistic approach—connecting automation and workflows across tools.
“Most of what we do for production readiness is already automated, but by different systems. I would like a more holistic approach. I would like to see everything in a single dashboard because reliability is critical for our industry.”
Senior Engineering Manager @ 10,000+ person company
“We need to automate everything after you deploy the software. Drift is very difficult to handle.”
Director of System Services & System Engineering @ 10,000+ person company
“Honestly I’d like to automate as much as possible. Having even just a workflow for dates and the person acknowledging things would be better than we have now. Connection between pre-established norms, their execution, and a dashboard would be the holy grail.”
Director of Engineering @ 500-1,000 person company
42% of respondents mentioned testing, validation, and code coverage
Respondents expressed a strong desire for more automation in testing and validation processes. This includes automating unit tests, integration tests, and performance tests to ensure code quality. Many organizations also mentioned already employing tools designed to help with this.
“I would like to increase automated testing and automation to create change management tickets with a standard template. This is only possible if every team starts following a standard change template and process.”
Engineering Lead @ 10,000+ person company
38% of respondents mentioned ownership, on-call, runbooks, or documentation
Unlike security and testing tools, participants mentioned a gap in automating things like ownership and attaching documentation or runbooks. There seems to be a clear desire for technology that could automatically follow-up with developers to make these requirements obvious.
“I would like to automate the documentation process—where the new feature is documented, how it fits the overall architecture,
its dependencies, and the run book of both what could go wrong and what to do.”
Software Engineering Lead @ 1,000-5,000 person company
28% of respondents mentioned security, compliance, risk, or vulnerability assessments
Security and compliance are critical aspects of the PRR process that respondents want to see automated. This includes automating security checks, vulnerability scans, and compliance with data privacy policies to ensure the software is secure and adheres to regulations.
“Currently, we automate security package vulnerability scanning, testing (at least some), and dependency inspection. We don't automate business SLOs (some services have health SLOs monitored, such as uptime, number of requests, etc) which is a big one. There is a custom tool being built for business metrics monitoring, which is the most important thing, as it's not directly related to common health metrics, which are monitored in Grafana with Prometheus.”
Software Engineering Manager @ 1,000-5,000 person company
28% of respondents mentioned infra provisioning or SLOs
Automation of deployment processes and monitoring setups were also frequently mentioned. Respondents are looking for ways to automate the deployment validation, monitoring, and alerting setup to ensure a smooth and reliable production release.
“Automated testing, deployment validation, and infrastructure checks are key areas for efficient production readiness assessment automation.”
Software Engineering Manager @ 10,000+ person company
How Internal Developer Portals improve the production readiness process
The results of this survey highlighted the disparity in production readiness approach, tooling, and perceived effectiveness. But there were a few noteworthy trends that united all participants:
Alignment is hard. As organizations adopt frameworks designed to help developers ship faster, an inability to manage the knock-on effect of information entropy has introduced new risk, hampered velocity, and degraded productivity.
Automation is key. Most leaders identified activities in their production readiness checklist that they have not been able to automate. This has led to either lack of attention to these tasks, lack of continuity, or lack of efficient management.
Assessment must be continuous. Leaders that reported the highest levels of confidence spoke of the importance of continuous standards enforcement, and have taken steps to make this a regular part of their production readiness lifecycle.
Internal Developer Portals were designed to address all three dimensions of production readiness, enabling developers to reduce time to find, time to fix, and time to build. By centralizing access to the tools and information developers need to build, while automatically tracking alignment to standards over time, IDPs are the most efficient way to improve productivity without compromising quality.
Three ways IDPs drive better production readiness includes:
Centralize data and standards across all tools
Many organizations employ different software standards in tools specific to each set of requirements. For example, teams may have observability standards managed in their APM tools, or security standards managed in vulnerability management tools. This siloed approach might seem easier than manually collating data defined differently everywhere, but that’s no longer the only option.
Internal developer portals connect to all engineering and identity tools to unite information about software owners, composition, health, and efficiency. Beyond a central system of record for engineering data, IDPs also unite once siloed-standards, so teams can manage security standards where testing standards are tracked. Or build compliance standards where observability standards live.
Cortex’s IDP was designed to facilitate maximum flexibility without excessive overhead. Fully custom catalogs, 50+ out of the box integrations, the ability to bring in custom data, and a rich plugin architecture enables teams to build new data experiences that best fit developer workflows. So anything that details how software is built, by whom, when, and how, can be captured by catalogs segmented by software type like services, resources, APIs, infrastructure, etc. Any standard that governs how code is written, tested, secured, reviewed, or deployed can be unified, and even re-segmented by team, type, domain, or exemption status, to ensure all components are managed in context.
Apply always-on standards for continuous alignment
Code repos, project management tools, and wikis are all indisputably useful tools for engineering teams. But none have a live view of the rest of your software ecosystem, which means none can tell you when software falls out of alignment with critical requirements for security, compliance, or efficiency.
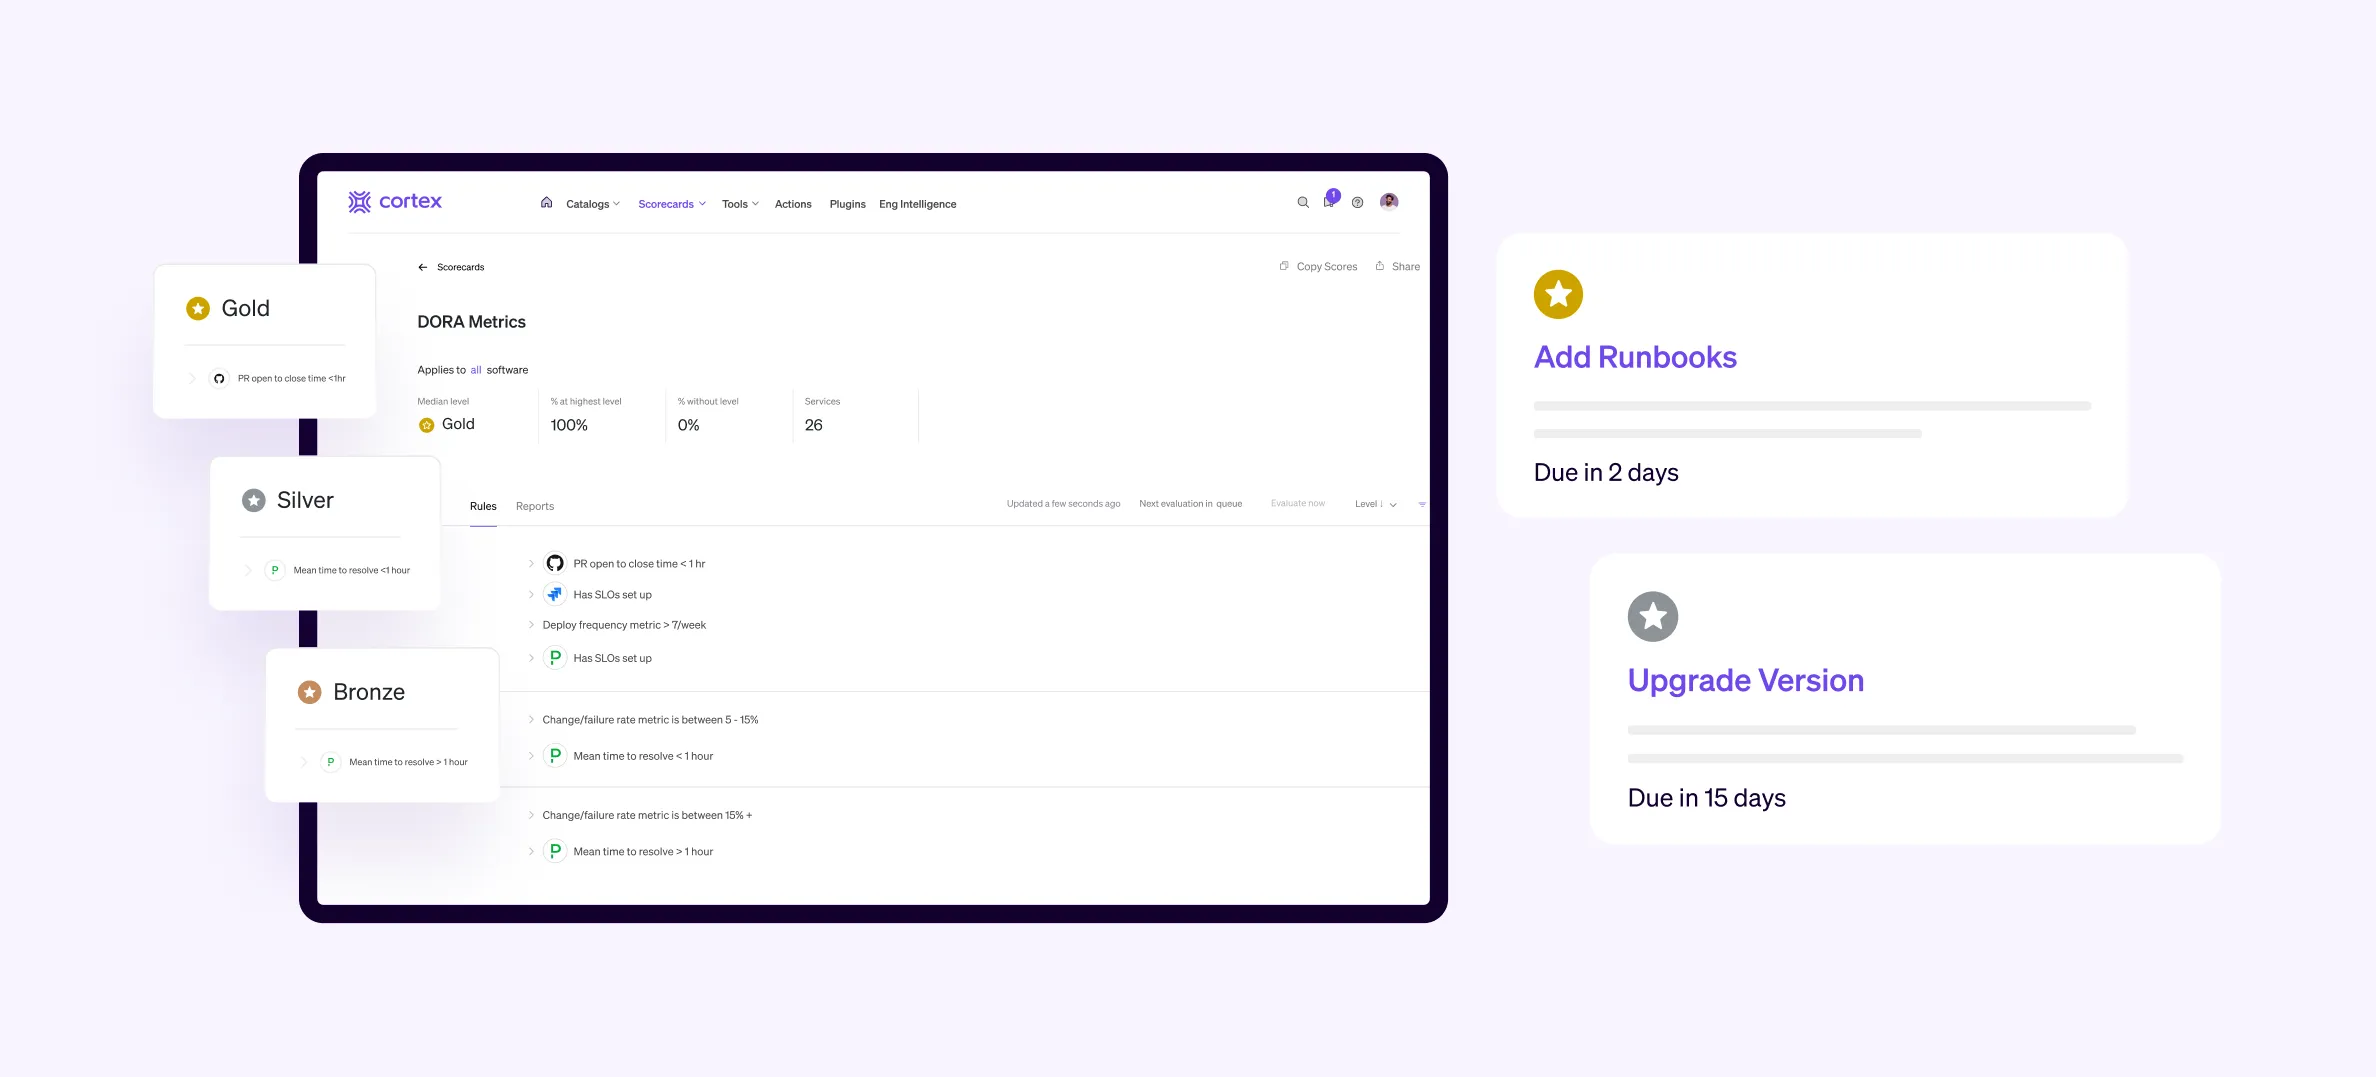
Internal Developer Portals fill this gap with scorecards. Because IDPs are a one-stop-shop for all your data and documentation, they can also serve as a means of continuously monitoring alignment to all software standards you define in a scorecard. So if code is updated, ownership changes, new tools are adopted, or old packages hit end-of-life, your IDP makes it easy to see what needs attention.
Of course, not all IDPs provide this capability. Cortex is the only IDP that provides the level of data model flexibility to define any rule, for any data, targeting any audience.
This means users can create Scorecards with rule types like:
Binary: Check for connection to a vulnerability scanner or use of the most up to date package
Target: Require at least 70% code coverage or two reviewers
Threshold: Allow no more than one p0 vulnerability, or five open JIRA tickets per service
In order to ensure scorecards aren’t just passive assessment systems, Cortex also enables teams to drive meaningful action by:
Defining deadlines—so certain measures are actioned before a set date and time
Pushing alerts—via Slack, Teams, or email to ensure devs know what’s needed, when
Uploading exemption lists—to target only the folks that need to take action
Provide approved templates to ship quality code quickly
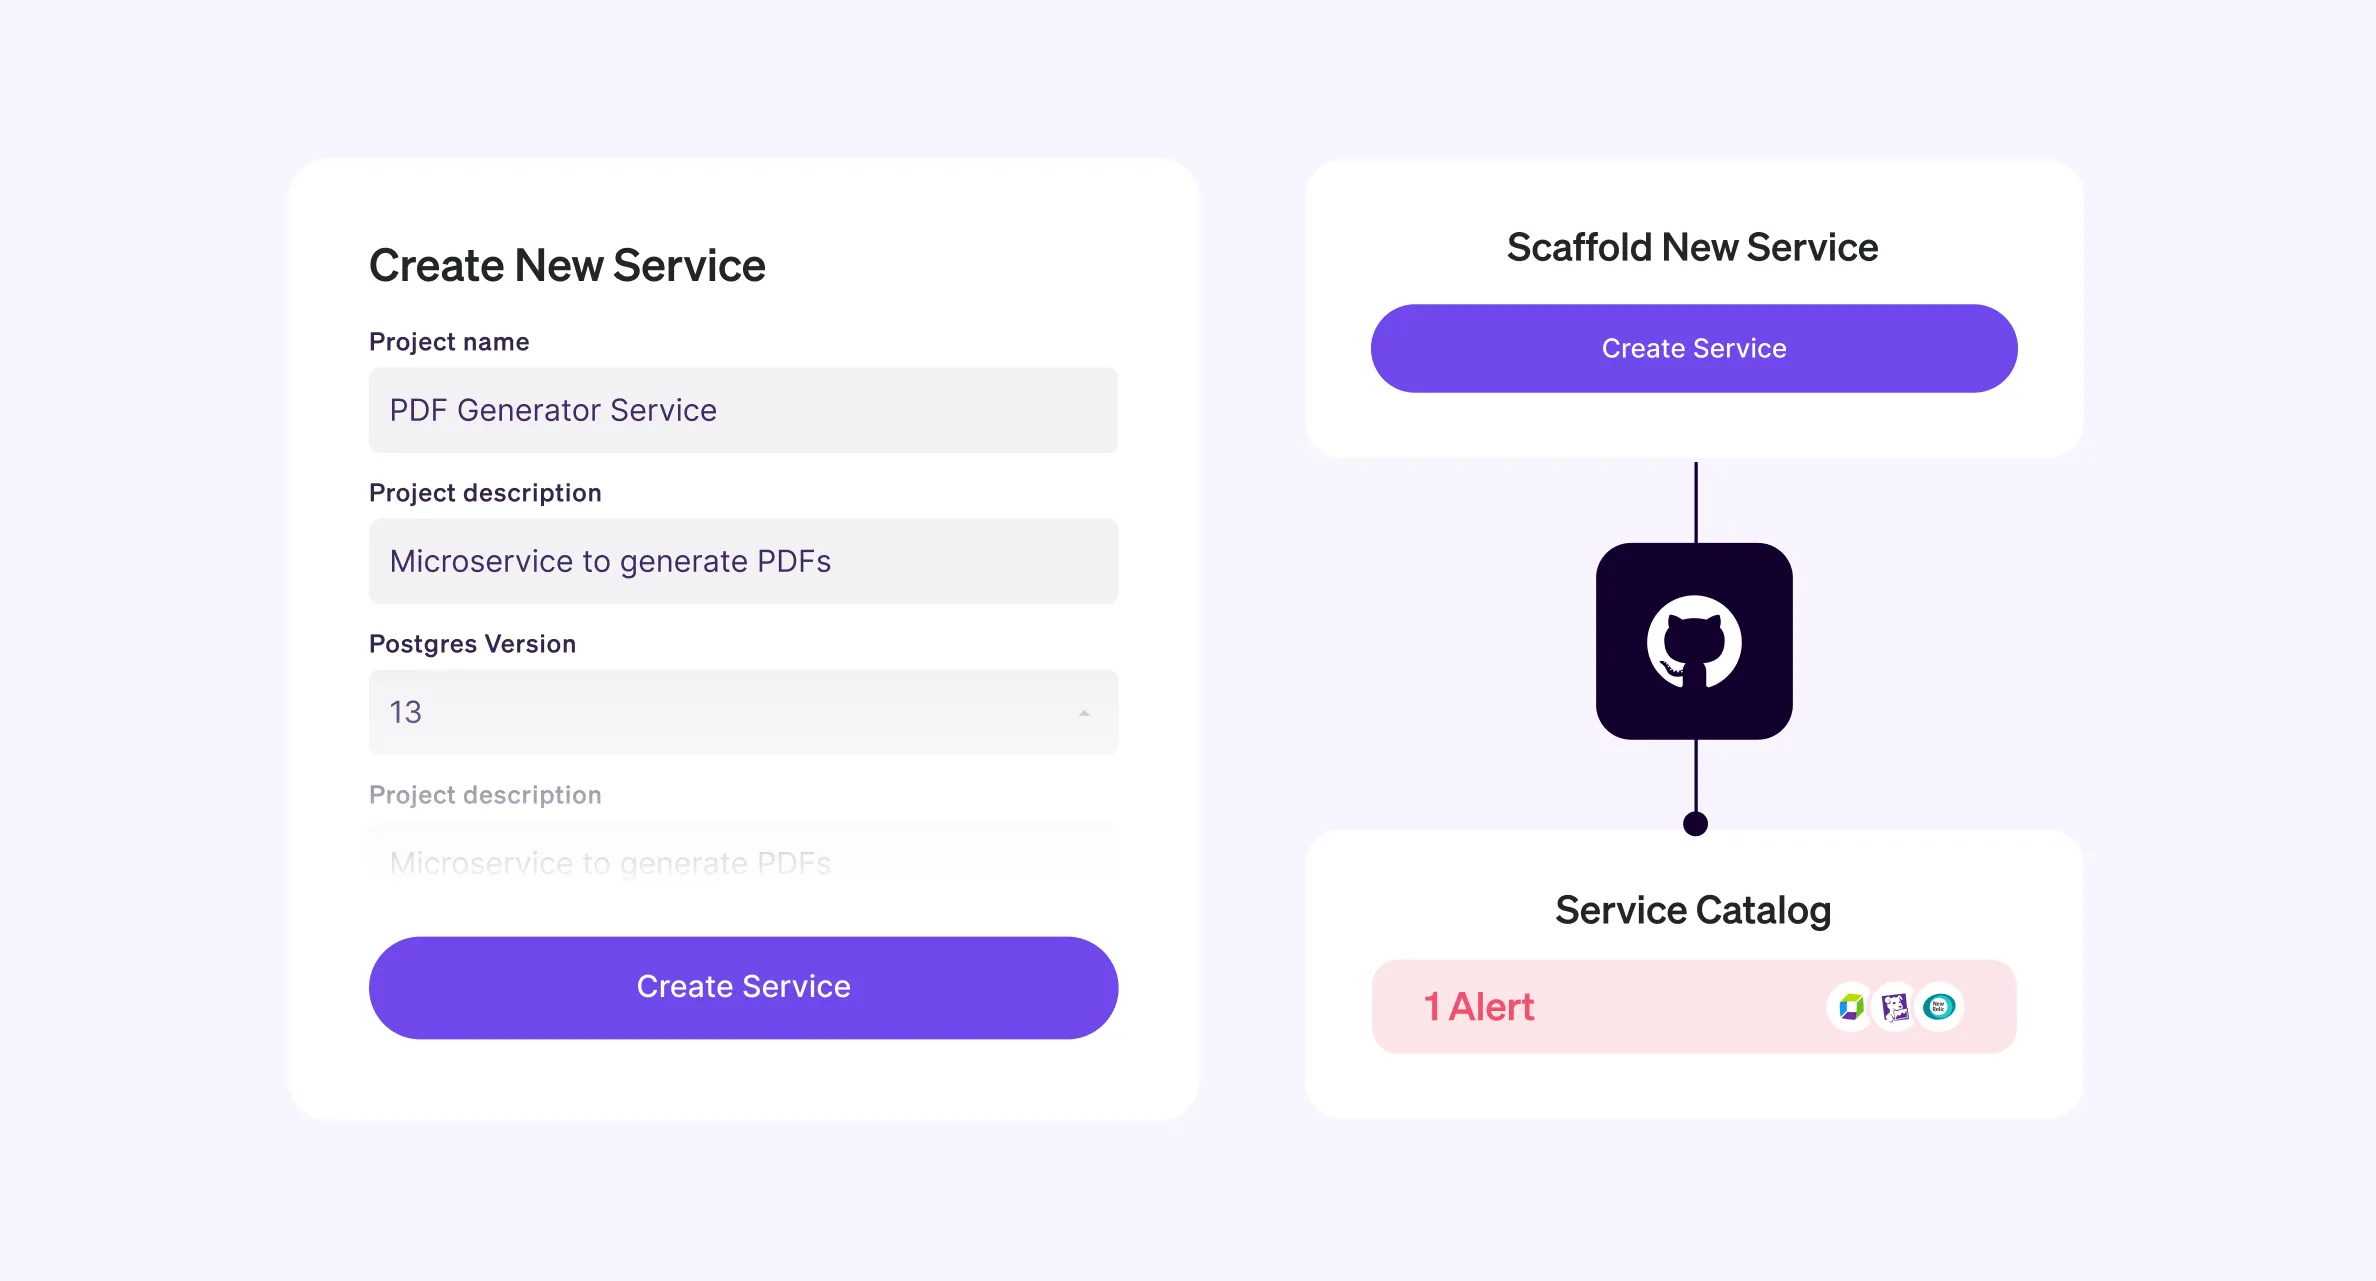
Enabling self-service is a top priority engineering leaders that care about both developer productivity, and happiness. But self-service also contributes to higher quality software, and therefore should be part of any robust production readiness process. Internal Developer Portals enable teams to create pre-approved templates with health checks built in, so developers can reduce time spent looking for standards and context-switching across applications.
Cortex enables teams to not only build production readiness standards into templates with boilerplate code, but also initiate any workflow from within the platform using a customizable HTTP request. So developers can do things like:
Make an API call to AWS
Deploy a service
Provision a resource
Assign a temporary access key
Create a JIRA ticket, or r any other action that would help the developer complete a task, or in this case, their production readiness checklist
Self-serve templates and workflows are also especially useful for onboarding new developers that would normally need time to ramp on your chosen production readiness protocol. By centralizing the tools and templates needed to align with standards, time to impact can be drastically reduced.
Conclusions
Production readiness is a necessary process for any organization developing software. While every team will have a slightly different set of requirements and order of execution based on their business, there are clear trends in our study that should give any engineering leader a few things to think about when designing or updating their own program.
First, on-going ownership is vital to ensuring on-going software health. If a component’s ownership information is stagnant even by a week, the downstream impact to incident response, security, and compliance can be severe. Finding a solution that connects to your identity management system is the quickest way to avoid orphaned software that can introduce risk.
Second, regardless of which items comprise your production readiness readiness checklist, having a way to continuously monitor alignment to those standards is key. Having up-to-date information in one place reduces the need to manually cross-reference disparate data, and can help eliminate unnecessary status stand-ups that burn manager and developer hours.
Finally, having a strong production readiness program has many benefits beyond software security and reliability. If using tools like Internal Developer Portals, additional benefits to developers include:
Reduced time to find the right set of standards
Reduced time spent fixing avoidable issues
Reduced time to code and time in approvals when building new software, and
Reduced time context switching by planning routine health upgrades around current work.
All of these savings accrue to more efficient use of resources, higher developer productivity, faster time to market, and happier teams.
For more information on how Cortex’s Internal Developer Portal can improve your production readiness process, check out our self-guided tour, or connect with us for a personalized demonstration.


