
Engineering leaders who've outgrown their current tooling know the feeling. Their dashboards show plenty of numbers, but nobody's shipping differently because of them. Jellyfish built a strong business helping engineering teams quantify effort: how time gets allocated, where resources go, and whether work aligns to business goals. For many teams, it's been the default choice.
But default isn't the same as best fit. Whether you're hitting limits on flexibility, spending too long configuring reports, or realizing you need something that goes beyond measurement into action, there are alternatives worth evaluating. This guide covers seven of the strongest options for 2026, including what they do well and where they fall short.
What Is Jellyfish?
Jellyfish is a software engineering intelligence platform that aggregates data from tools like Jira, GitHub, and Bitbucket to give leaders visibility into how engineering time is spent. The platform generates virtual time cards showing allocation across roadmap work, support, infrastructure, and unplanned tasks, letting managers see where engineering hours go.
Jellyfish's core value proposition is turning developer tool data into productivity insights that help drive measurable impact. Finance teams use it for software capitalization reporting. VPs of Engineering use it to justify resource allocation or identify workflow bottlenecks. Product leaders use it to inform roadmap strategy. The platform has also recently added AI impact measurement, tracking the productivity effects of AI coding tools.
For organizations that primarily need a top-down view of engineering investments, Jellyfish delivers. Where it falls short is in taking the next step beyond visibility. Turning those numbers into behavioral change is a challenging problem, and the gap between reporting and improvement is where most teams get stuck.
How Jellyfish Falls Short as an Engineering Operations Solution
Jellyfish is powerful, but G2 reviews and user feedback consistently surface a few friction points:
Steep learning curve and complex UX. Sprint insights, custom reports, and configuration options are often buried. Users report spending significant time just learning how to surface the data they need, and creating meaningful custom configurations can take weeks.
Integration and setup friction. Users have reported issues with specific integrations (Okta and Jira are recurring complaints), and initial setup can stretch longer than expected for organizations with complex tool ecosystems.
Rigid constructs with limited extensibility. Jellyfish is opinionated about how it models teams and workflows. If your organization has unusual structures or edge cases, you may find yourself working around the tool rather than with it. The lack of a public API for extracting engineering metrics compounds this. Your data lives inside Jellyfish, and that's where it stays.
Metrics without context or action items. This is the most common complaint. Jellyfish gives you numbers. It does not always tell you what to do with them. When metrics exist in isolation, disconnected from service health, software maturity, or operational standards, they risk becoming performance surveillance rather than improvement levers. (Contextualizing metrics is what separates useful measurement from noise.)
For some teams, these aren’t necessarily dealbreakers. But if two or more apply to your organization, it's worth evaluating what else is out there.
Best Alternatives to Jellyfish for Engineering Operations
These platforms split into three camps: metrics aggregators (show you the numbers), automation tools (act on the numbers), and engineering operations platforms (change how the work actually happens). Cortex defined the third camp. It includes the service catalog, ownership clarity, scorecards, and golden paths people associate with internal developer portals, and pushes further into engineering analytics, initiatives, and AI readiness to drive action and cultivate engineering excellence.
Before you evaluate, decide whether you need better dashboards or a system that changes how your engineering teams actually build software. The answer shapes everything.
1. Cortex
Cortex is an engineering operations platform that enables organizations to continuously improve their operational maturity and reduce developer friction, so that the whole organization operates as one. By unlocking a culture of engineering excellence, Cortex customers reduce incidents, improve MTTR, and make it easier for developers to focus on building. Where most alternatives on this list aggregate metrics, Cortex connects productivity data to the operational context that makes those metrics meaningful: service health, production readiness, dependency relationships, and ownership.
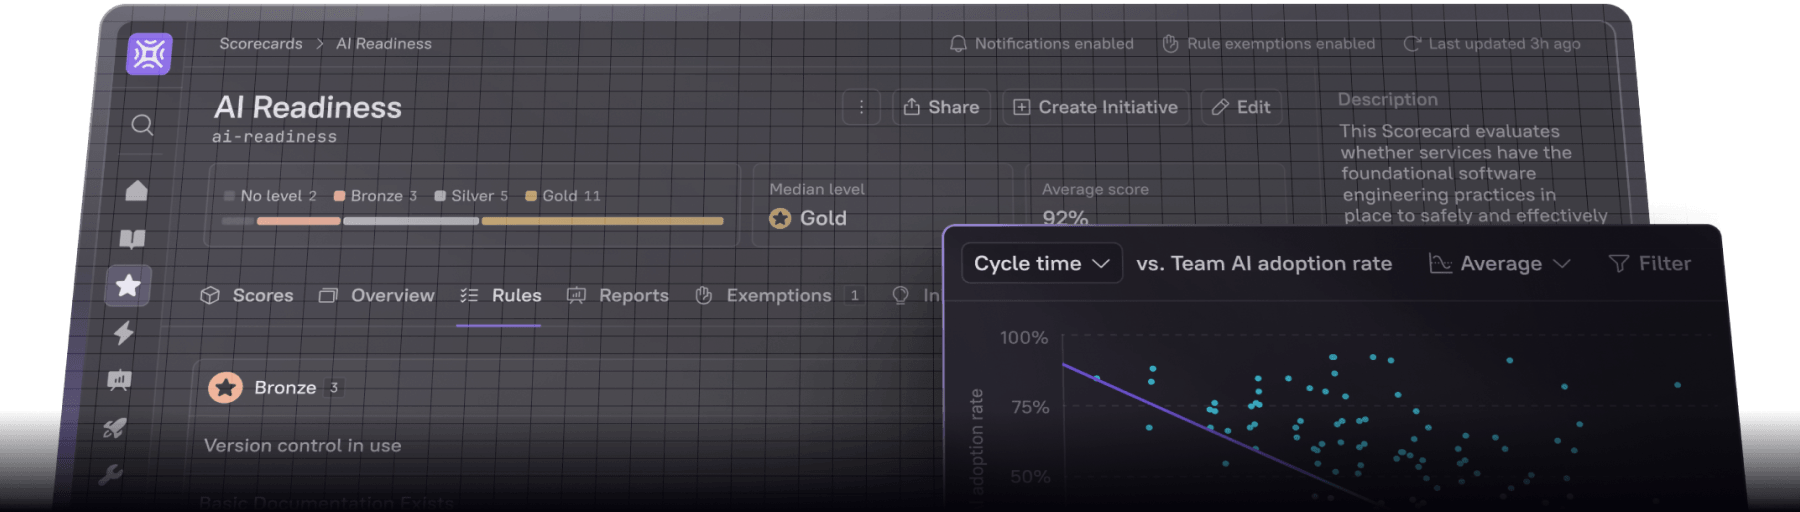
The platform ingests data from 50+ integrations across your git, CI/CD, cloud, identity, security, and ticketing tools to maintain an always-current system of record. Cortex's Engineering Intelligence layer then lets leaders do something no pure-play metrics tool can. You can directly compare delivery performance metrics (PR size, cycle time, deployment frequency) against custom measures of software maturity, security posture, and operational readiness.
In practice, this means an engineering director can see that Team A's cycle time improved 20%, and see that it happened because they paid down the tech debt flagged by a Cortex Scorecard two sprints ago. That cause-and-effect visibility is what turns metrics from surveillance into strategy, and connects engineering health directly to business impact.
Across Cortex's customer base, engineering teams using Engineering Intelligence data with Scorecards and Initiatives have reported a 30% reduction in incidents and a 50% improvement in MTTR.
Cortex Pros & Cons
Pros:
50+ out-of-the-box integrations with all major developer tools, providing genuinely comprehensive data coverage, including Jira, GitHub, GitLab, PagerDuty, Datadog, AWS, Okta, and Snyk
Engineering metrics designed for engineers, not just managers. Productivity data connects to service quality and reliability
Automated Scorecards measure service maturity, production readiness, and quality standards with clear, trackable targets
Service catalog gives teams a single source of truth for microservice ownership, dependencies, and relationships
Initiatives turn scorecard targets into time-boxed improvement campaigns with automated progress tracking
Cons:
Priced for engineering organizations at scale. Teams with fewer than ~50 engineers may find Cortex more than they need today. ROI compounds as service count, team count, and operational complexity grow.
Best fit for engineering teams ready to operationalize standards. Cortex isn't a dashboard you skim. It's an operational layer that requires real adoption to deliver full value. Initial integration is fast (most teams see value within weeks, not the months Backstage typically demands), but the platform rewards teams who treat it as the source of truth, not just another tool to check.
Opinionated by design. Cortex enforces structure where frameworks like Backstage make you build from scratch. That structure is why it works at enterprise scale out of the box. Teams with highly unconventional organizational models occasionally adapt their mental model to Cortex's rather than fully customize Cortex's to theirs.
Top Features of Cortex
Dynamic Scorecards and Initiatives: Define what good looks like for your services, set deadlines, and track team-by-team progress toward operational standards.
Engineering Intelligence Dashboards: Velocity, DORA, AI Impact, plus custom dashboards you can slice by team, repo, or author, then correlate against service health.
Automated Service Catalog: A living map of your architecture, ownership, dependencies, and documentation, updated automatically via integrations.
Cortex Context Graph and MCP: Cortex's AI-powered catalog discovery surfaces dependencies, ownership gaps, and operational risks across your stack. Cortex MCP delivers operational context directly into AI coding tools through the Model Context Protocol.
Initiatives with Automated Actions: Launch organization-wide improvement campaigns (migrate off deprecated libraries, add runbooks to critical services) and track compliance without manual follow-up.
Templates and Scaffolding: Standardize how new services get created so they're production-ready from day one.
Improve Engineering Operations with Cortex
Most engineering platforms stop at the numbers. Cortex names the services, the owners, and the standards they're failing. Then it tracks the work to fix them.
Centralize operational data across every service, team, and domain, not just the ones someone remembers to audit manually.
Replace intuition with evidence and optimize against your own standards in addition to industry benchmarks.
Encode best practices into Scorecards and drive improvement through time-boxed Initiatives with clear owners and deadlines.
Cut incident resolution time by guaranteeing every service has documented ownership, runbooks, and escalation paths before the 2 AM page.
Chris Ramsay, Principal DevOps Engineer at Vista, built internal AI tools on top of Cortex data. "Being able to query Cortex through ChatGPT or Slack and get ownership or repo links instantly is game-changing," he said.
H&R Block used Cortex as a single source of truth for their engineering ecosystem to automate governance and compliance workflows. With Cortex, they reduced MTTR from up to 24 hours to less than one hour, and cut Mean Time to Acknowledge (MTTA) to under 10 minutes.
Accelerate Developer Productivity with Cortex
The fastest way to make developers more productive isn't measuring their output. It's removing the friction that slows them down. Cortex gives developers self-service access to operational context (service ownership, current health, runbook locations) without filing tickets or waiting on Slack. This is the core of good developer experience, and it compounds over time.
Combined with Engineering Intelligence dashboards, leaders can pinpoint exactly where in the software development pipeline time bleeds out and determine whether the fix is a process change, a tooling investment, or a Scorecard initiative to bring lagging services up to standard.
Migrating from Jellyfish?
Cortex pulls from the same source systems Jellyfish does (Jira, GitHub, GitLab, your CI/CD pipeline), so you don't lose historical data when you switch. The bigger transition isn't technical, it's operational. Cortex isn't a reporting tool you check on Mondays. It's the mission-control layer your software teams leverage every day.
Watch the on-demand webinar: Engineering in the Age of AI →
2. LinearB
LinearB got their start as a metrics platform but recently pivoted into AI-powered workflow automation. The platform's standout capabilities include AI-powered code reviews that catch security risks before merge, project forecasting that models delivery probabilities using historical data, and a Developer Coaching Dashboard for data-driven team performance conversations. LinearB also measures AI coding tool adoption, which matters as more organizations roll out Copilot and similar assistants.
LinearB reports that engineering teams using the platform reduce cycle time by an average of 19% in the first year. Setup is straightforward, and users get a dedicated success manager who helps them customize the system and start seeing value quickly. Pricing starts at $29/contributor/month.
LinearB Pros & Cons
Pros:
AI code reviews and workflow automation go beyond measurement into active improvement
Monte Carlo forecasting provides probabilistic delivery estimates that finance and product teams actually trust
Easy setup with dedicated success managers
Strong DORA metrics implementation with clear, intuitive dashboards
Enterprise-ready: SOC 2 Type 2, ISO27001, GDPR, with on-premise deployment options
Cons:
Narrower integration set, primarily focused on core developer tools (GitHub, Jira, Jenkins)
Less contextual depth around service health and operational maturity
Free tier limited to 10 developers
Best For
Teams that want to optimize workflows with automation and AI-powered improvements alongside their metrics, particularly organizations already committed to a GitHub/Jira/Jenkins stack.
3. Pluralsight Flow
Pluralsight Flow (formerly GitPrime) was acquired by Appfire in 2025. It now operates as a standalone product, though it remains bundled with Pluralsight enterprise contracts for some customers.
Flow transforms commit, ticket, and PR data into engineering insights, with a focus on activity metrics like active days, commit patterns, code churn, and efficiency ratios. It also provides CapEx data reports that finance teams find useful for software capitalization.
The platform includes collaboration features like comments and feedback on tasks, plus a Team Health view that helps managers identify team members who might be over- or under-loaded. Pricing starts at $50/user/month.
Pluralsight Flow Pros & Cons
Pros:
Strong CapEx and software capitalization reporting for finance stakeholders
Team Health features promote collaboration and surface workload imbalances
Works across GitHub, GitLab, Bitbucket, and Azure Repos
Good for organizations that also use Pluralsight for learning and development
Cons:
Activity-based metrics (active days, code churn) feel increasingly outdated, measuring who's doing things rather than what's getting done
Product development and UI modernization have slowed relative to newer competitors
Pricing jumped after the Appfire acquisition
Lacks clarity on how some metrics are calculated
Best For
Organizations already in the Pluralsight ecosystem, or teams that need strong software capitalization reporting for finance compliance.
4. Code Climate
Code Climate was an engineering intelligence platform that used pull requests as its fundamental unit of engineering work measurement. It has recently pivoted to offering a combination of software + services that help enterprises build AI-native software organizations.
Code Climate Pros & Cons
Pros:
PR-based measurement provides clear, understandable metrics that map to actual work
Burnout review and new hire tracking add a human element missing from many competitors
In-app benchmarks let teams compare team performance against industry standards
Metrics API enables integration with existing BI infrastructure
Cons:
Limited documentation can make implementation harder than it needs to be
Company pivot in core focus areas, future support for Code Climate Velocity uncertain
Best For
Teams that want PR-driven insights with executive reporting, particularly organizations that already use BI tools and want engineering data flowing into them.
5. Allstacks
Allstacks differentiates through forecasting. The software engineering intelligence platform analyzes software delivery lifecycle data to project outcomes, generate risk assessments, and produce reports that support proactive decision-making rather than just report on past performance.
Allstacks AI-agent offerings span three pillars: Software Engineering Intelligence, Product Studio for agentic requirements building, and R&D Capitalization Reporting. Allstacks is notably transparent about the data behind its metrics. Users can drill into the underlying data powering any chart, which builds trust in a way that black-box approaches don't. Pricing starts at $200/contributor/year for R&D Cap offerings.
Allstacks Pros & Cons
Pros:
Forecasting and risk assessment capabilities are genuinely differentiated
Transparency into underlying data behind every metric and visualization
Intelligence Engine offers AI-driven analysis beyond static dashboards
Free version available for initial evaluation
Strong R&D capitalization reporting
Cons:
Data retrieval from sources can lag, which is a problem if you need near-real-time insights
User management (onboarding, team associations, employee changes) is more manual than competitors
Integration set is not as broad as some alternatives
Best For
Development teams that value forecasting and risk prediction over retrospective metrics, particularly useful for organizations where delivery predictability is a key executive concern.
6. Swarmia
Swarmia is an engineering insights platform that covers three modules: Developer Productivity (DORA metrics, cycle time), Business Outcomes (investment balance, portfolio tracking, software capitalization), and Developer Experience (recurring surveys correlated with developer metrics). This modular structure means you can buy just what you need rather than paying for a monolithic platform. Free for companies with up to 9 developers, beyond that, pricing starts at $23/developer/month.
Swarmia Pros & Cons
Pros:
Clean, user-friendly setup with excellent documentation and customer support
Modular pricing lets you buy only the capabilities you need
Developer surveys correlated with DORA metrics provide qualitative + quantitative insight
Free tier for up to 9 developers lets small teams evaluate without commitment
Strong anti-surveillance positioning that developers appreciate
Cons:
Less suited for large organizations because aggregating data across many teams can be limited
Narrower integration set compared to competitors
Relatively newer product, so feature depth in some areas lags behind mature competitors
Best For
Small-to-mid-size engineering teams that want clean DORA/SPACE metrics with developer experience surveys, particularly teams that are sensitive to surveillance concerns and want a tool developers will actually trust.
7. Waydev
Waydev is a SOC 3-compliant, Y Combinator-backed AI engineering intelligence platform. Waydev's newest product offerings include four new AI modules (AI Adoption, AI Impact, AI ROI, and Waydev Agent) layered on top of its existing DORA Metrics, SPACE Framework, DX surveys, cycle time, resource planning, and cost capitalization capabilities. Customers include Citi Ventures, PwC, and other Fortune 500s.
Waydev Pros & Cons
Pros:
Comprehensive framework coverage (DORA + SPACE + DX in one platform)
Strong AI coding tool adoption tracking, including like Devin and Cursor
MCP integration for delivering insights directly in developer tools
Cons:
The UI and features change frequently, and documentation doesn't always keep up
Onboarding is more arduous than advertised
Metrics are difficult to turn into meaningful actionable insights and activity is difficult to tie to business outcomes
Historical data retention is paywalled
Best For
Organizations that want an AI-native approach to engineering analytics, particularly those already investing heavily in AI coding tools and wanting a unified view of adoption and impact across their team.
Choosing the Right Jellyfish Alternative
This market looks different than it did two years ago. Every platform on this list surfaces similar key metrics and has added AI features, forecasting, or both. The best analytics tool isn't the one with the longest feature list. It's the one that helps engineering teams optimize how they actually ship software and reduce friction in the development process.
For software engineering organizations that want to streamline operations beyond measurement, turning insights into automated workflows, codified standards, and continuous improvement, Cortex is the natural fit.
Updated May 2026