
Teams that know not to treat testing as a last-minute effort are writing tests throughout the development life cycle. This is well and good, considering how important it is to treat testing as an ongoing exercise. However, it is equally important to think about the quality of these tests. Are they testing every line of code in your program? Are they testing for the right things?
Measuring code coverage is an effective way of boosting the quality of your code as well as ensuring that your tests are constructive. In this article, we examine a few code coverage tools and how you can work them into your development process.
What is code coverage?
Code coverage is a measure that assesses the extent to which your source code has been tested and validated. It is central to determining whether your testing apparatus is performing its job well.
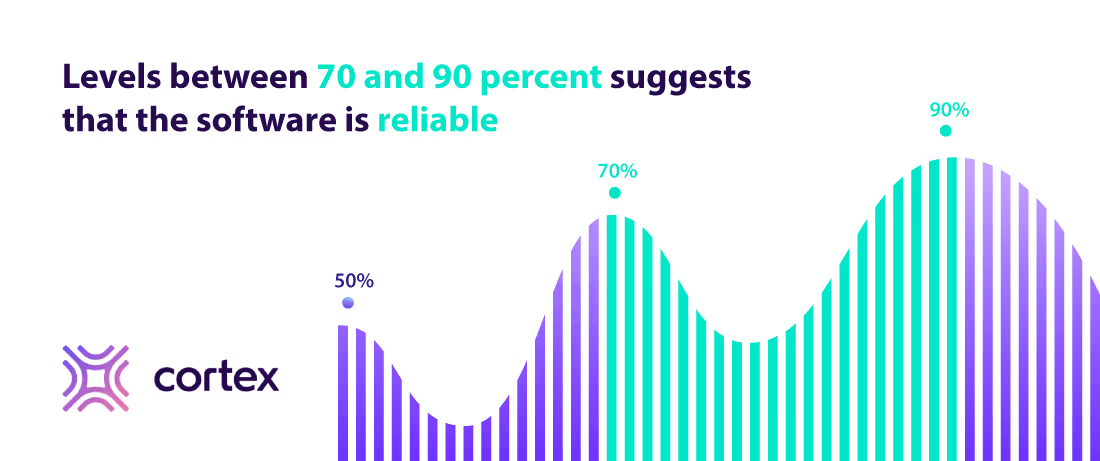
Regular testing is one of the key practices to building reliable and secure software. By testing at multiple steps during the development process, teams can continuously improve the product without having to patch it up right before deployment. Code coverage is a metric that analyzes and measures testing to ensure that it is being carried out effectively and as per your requirements.
Code coverage is usually measured alongside unit testing. This is one of the earlier stages of testing in the development life cycle, and running code coverage at this point helps determine whether the number of unit tests being run is adequate. These coverage metrics are usually calculated as a percentage of the items tested out of all items in the source code.
There are also a few coverage criteria that must be met by the testing suite in order for the code coverage to be deemed acceptable. Some of the basic criteria include:
Function coverage: Whether the test has called all necessary functions.
Line or Statement coverage: Whether every statement in the program has been executed at least once.
Path coverage: Whether each possible path in the code has been executed.
Branch coverage: Whether every branch in each control structure has been tested.
Condition coverage: Whether each Boolean sub-expression has been tested for both true and false values.
Other, more complicated criteria also exist. For example, some teams might be interested in understanding function and branch coverage together. This is called decision coverage. While the criteria can be distinguished, there exist connections between them and sometimes fixing issues in one can also impact another kind of coverage. Having visibility into multiple kinds of coverage also emphasizes and highlights these connections, offering a comprehensive picture of your code.
 Source: Sealights
How is code coverage useful?
At its core, code coverage helps monitor your testing mechanisms and how they are performing as part of your development life cycle. It is also indicative of test completeness, as it measures how much of the code is untested. Measuring code coverage also indirectly impacts code quality, which is vital for teams looking to build reliable software and maintain their codebases with ease. Developers will refrain from repeating mistakes and writing better code in the future.
When dead code that has no actual bearing on the program is detected, developers are able to look into the matter and get rid of unnecessary code to make the codebase more efficient or fix any errors so that every line of code is meaningful and is analyzed in future tests.
For quality assurance teams, code coverage offers visibility into code that was not included in the tests. This is useful to monitor the overall quality of the source code as well as the testing apparatus. The source code changes over time as new functionality is added to the software. Here, measuring code coverage plays an important role in that it ensures that the tests are up-to-date and established testing standards are upheld throughout the development process. One way for teams to do this is by introducing new test cases that can increase coverage with new developments in the code.
Code coverage is also useful because it tells you if you are testing edge cases and the business logic. If, for instance, you have if statements in your code and you do not end up testing the code inside these if statements, then code coverage tools can communicate important information such as the fact that an entire code block has never been touched, which makes it an area of risk.
The costs of fixing errors in the final stages are significantly higher than if they are identified as early as possible. Identifying code and test issues by measuring code coverage ensures that fewer bugs or vulnerabilities surface close to or during the production phase.
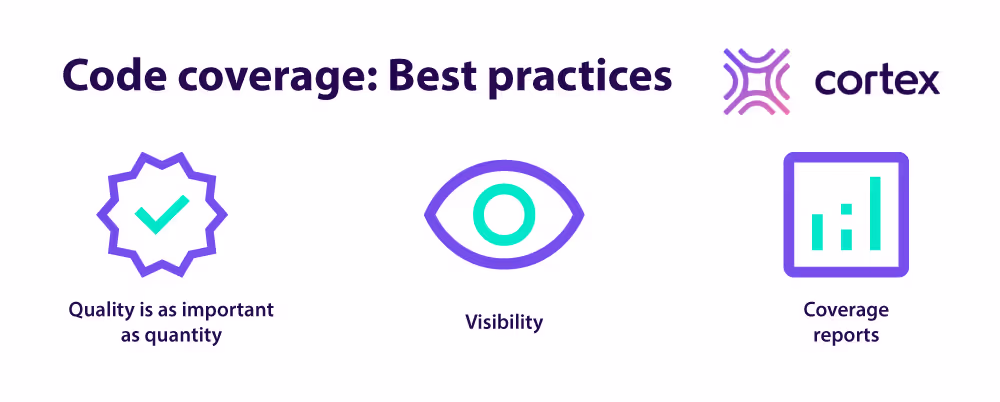
Best practices for measuring code coverage
Unlike static analysis, code coverage is measured by executing your program’s source code. It is usually incorporated into the code at intervals in the form of executable statements. Although this practice increases the length of your code, this is a minor inconvenience in the face of the benefits of doing it. In this section, we list some best practices and tips to make the most out of code coverage as part of your testing strategy.
Quality is as important as quantity
While code coverage is a useful metric to track in many ways, teams often make the mistake of assuming that if they are reporting high percentages of coverage, the tests are more or less effective. More often than not, however, high amounts of coverage are not directly correlated to code health. Instead, in addition to high coverage, you want to make sure that your code coverage testing mechanisms are of good quality. The tests should be doing their jobs as you intended, and they should be on the lookout for the appropriate items. So, you might have expansive code coverage, but you don't know if it is executing the correct tasks. To be sure, you want to do the following two things:
Define a set of business cases that you want to test and write unit tests for, i.e., to test their behavior.
Then treat code coverage as more of a sanity check. So its primary function is to inform you whether you have tested different parts of the code, such as the functions or the paths that the algorithm can go down.
Finally, keeping in mind that this is not the sole criteria for success, you can choose to decide on a minimum amount of coverage that needs to be achieved before the application can be tested at later stages.
Often, teams that are starting out will aim for high coverage and rush to achieve those percentages by writing tests that scan every line of code. It would instead be more useful to write tests keeping in mind the business cases for the software. We suggest encouraging teams to reflect on their testing strategy and aim for meaningful coverage.
Visibility
Code coverage can also never be a gate, i.e., you do not want to block merges on code coverage. Doing so will motivate developers to start gaming the system. They will write code in a way that helps them jack up the test coverage. Instead, one of the things you can do is to give visibility to code coverage by including it as part of global reporting. One way to push visibility across the organization into code coverage is through tools like SonarQube. You can also do so through a tool like Cortex, where you can pull in these metrics in a single place and observe the performance of each.
Another example of adding visibility to code coverage is running it as part of every pull request. For instance, by commenting on the pull request that a particular test or request reduces your test coverage to 70% or purely improves your test coverage to 85%. That way, if somebody on the team has made a mistake, they can see it in the pull request itself. They are not being blocked on it; instead, the objective is to provide information so that the team is aware and can use it to make improvements.
So, the more you encourage people to think of code coverage as a tool in their arsenal, the more likely it is that they will make use of it. On the other hand, if you use it as a weapon against them, developers will be put off by it and not bother with it.
Code coverage is both useful and easy to set up, so you want to include it as part of every repository and make sure that you are reporting on it. Every time you merge to master, get the latest numbers and update them to reflect the current state of affairs. That way, you can continuously report on it and display these reports in a centralized hub. Instead of forcing it down your team members’ throats, encourage its adoption to increase visibility. The more you increase visibility, the more likely it is that your developers will act on it and increase quality code coverage.
Coverage reports
Giving visibility is made easier by presenting coverage reports to team members. As the number and complexity of your tests increase, it is no longer easy to keep track of them. Tools that measure code coverage display the results in reports. Use these to understand the details of which tests worked, and what was left out.
Which code coverage tool is right for you?
Tools for measuring code coverage streamline the process and generate reports so that developers and the QA team can get to improving coverage and test or code quality. These tools can be more general or designed to be used on code written in specific languages. In this section, we look at some of the best solutions for improving code coverage metrics for your application.
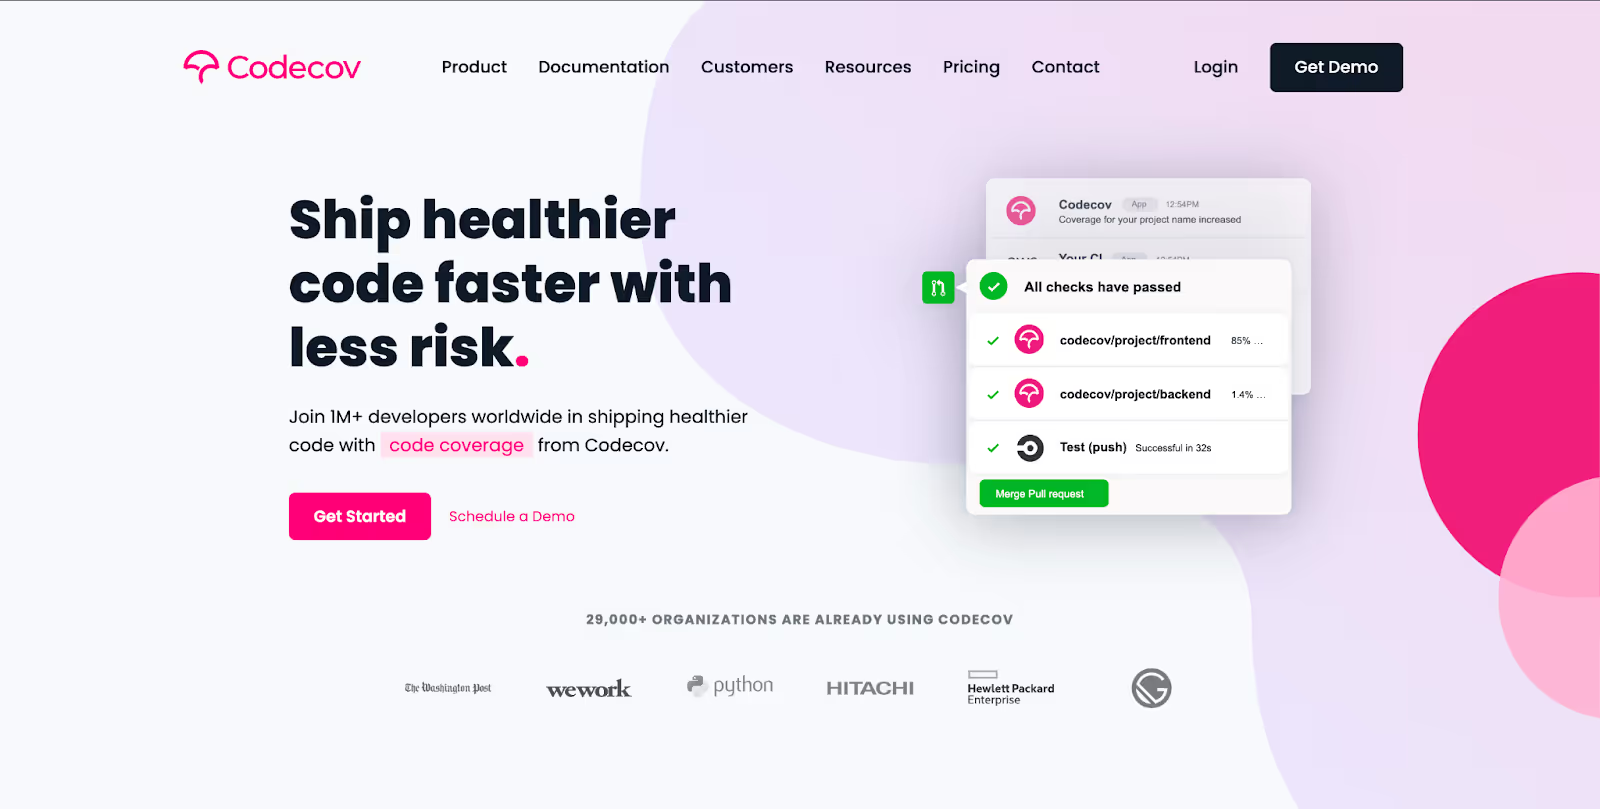
Codecov
Codecov is an industry leader in code coverage measurement. By offering services compatible with a host of programming languages and platforms, the tool has amassed over a million users today.
 It highlights the lines of code that are untested in your source code and generates insights in the form of coverage reports for easier analysis. The visually-rich presentation of these untested lines is a great feature that saves developers time and effort by pointing them to the exact areas that need to be checked.
The coverage summary reports appear as pull request comments so that developers have visibility within their workflows themselves and can take the appropriate actions quickly. The comment highlights the possible impacts of a pull request and can be customized as per the team’s needs. Furthermore, Codecov scans pull requests per the goal you set so that any PR that does not meet the status check is not automatically merged.
Codecov is highly customizable. It has centralized dashboards and the option to merge coverage reports for gaining a comprehensive idea of your existing coverage metrics. At the same time, teams can choose to isolate reports by category.
All in all, Codecov is a powerful tool that is made to integrate seamlessly with your workflows, no matter what that looks like.
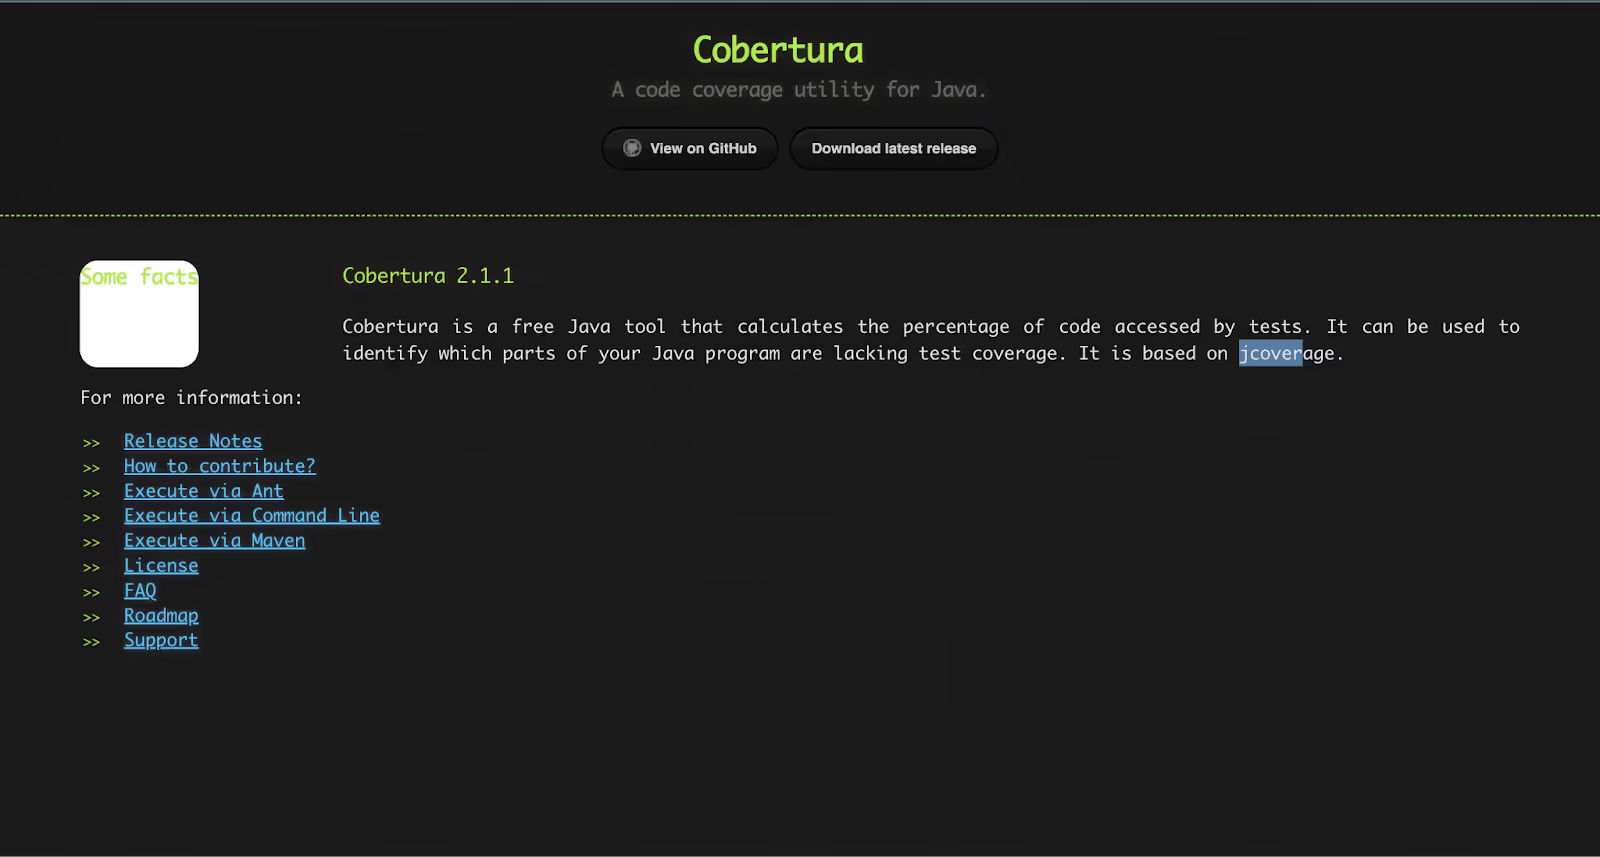
Cobertura
Cobertura is a tool to measure coverage in a Java codebase. It is a free tool based on jcoverage that calculates the percentage of lines and branches that are tested by unit tests. Cobertura executes code instrumentation operations to collect coverage data.Cobertura can be executed in multiple ways. You can either configure it with a Maven, Eclipse, or Gradle plugin, via Ant tasks or from the command line itself. After you run your tests, the tool produces HTML coverage reports. It also displays code complexity figures so that developers can better understand the relationship between how simple or complex their code is and what that means for the testing strategy they need to put together.
 Cobertura is an attractive choice for Java developers owing to its simplicity and ease of use. The reports are easy to read and can save developers time otherwise spent making sense of the insights instead of working to improve code coverage.
JaCoCo
Like Cobertura, JaCoCo is a code coverage tool for Java. Like Cobertura, it can be executed via a Maven plugin. It runs automatically when a JUnit test is performed. JaCoCo offers insights on line coverage, branch coverage, as well as cyclomatic complexity.
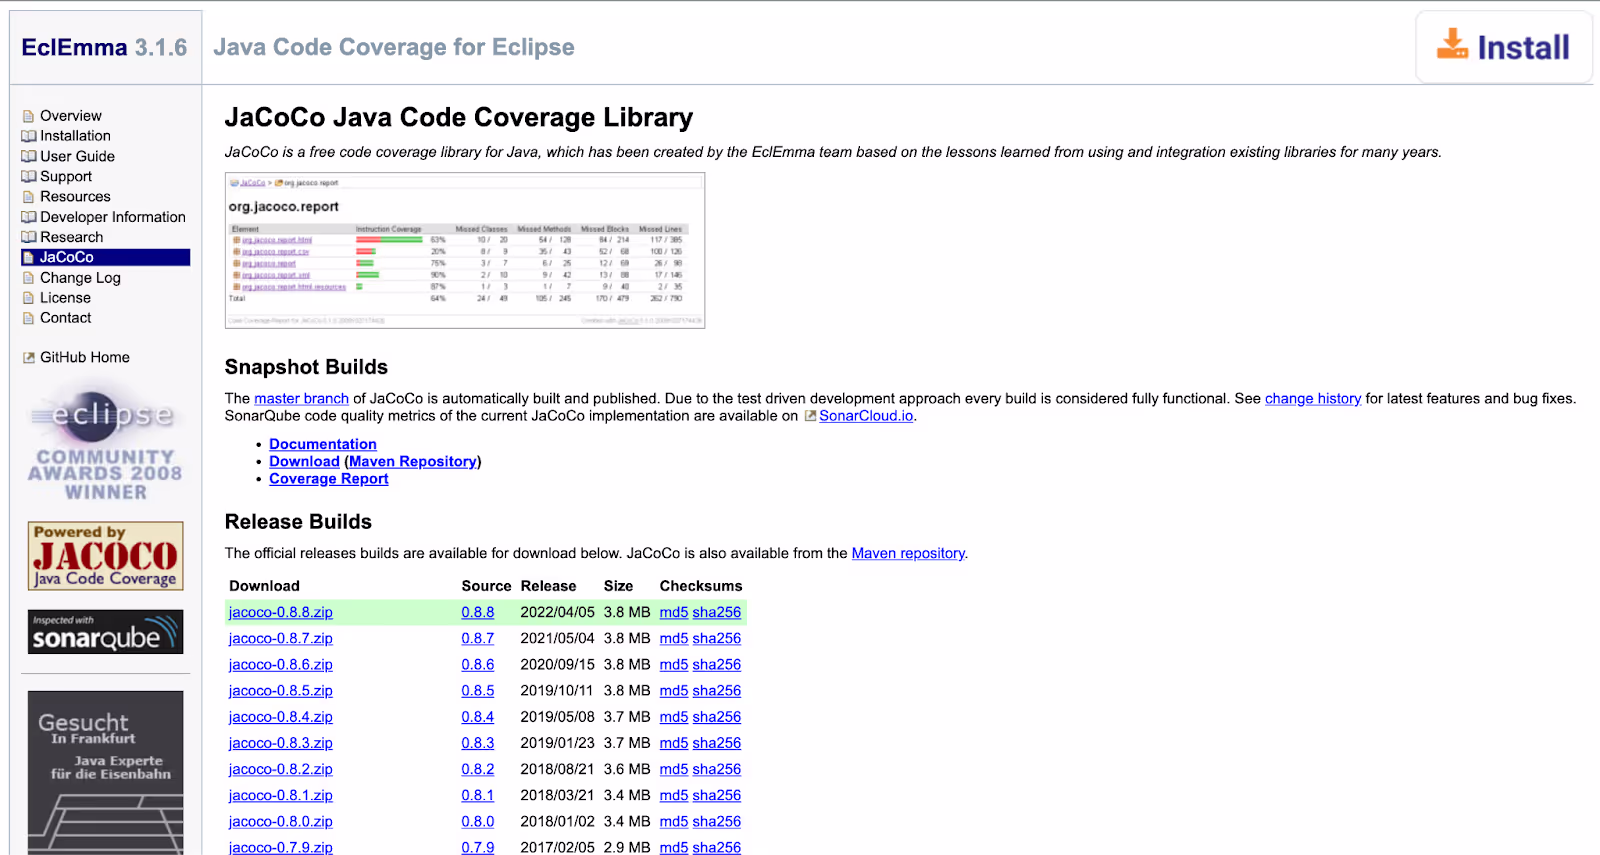 For developers to access the analysis, JaCoCo creates a coverage report. These reports are easy-to-understand as the tool highlights lines and branches in different colors to highlight whether they have been executed.
JaCoCo is built to provide Java developers with a simple and flexible code coverage library without too many dependencies. It can work without the source file and offers multiple possibilities for integration into developers’ workflows. JaCoCo also has robust documentation, which makes it easier for users to set it up.
Coverage.py
Coverage.py offers free code coverage analysis for programs developed in Python. Using the tool is a fairly straightforward process, from installing and running the coverage alongside your tests to viewing the results within the environment or exporting the report to an HTML file, among other formats. You can run it in the command line, and it comes with a C extension, whose primary contribution is speeding up the coverage measurement process, in addition to supporting some coverage.py features.
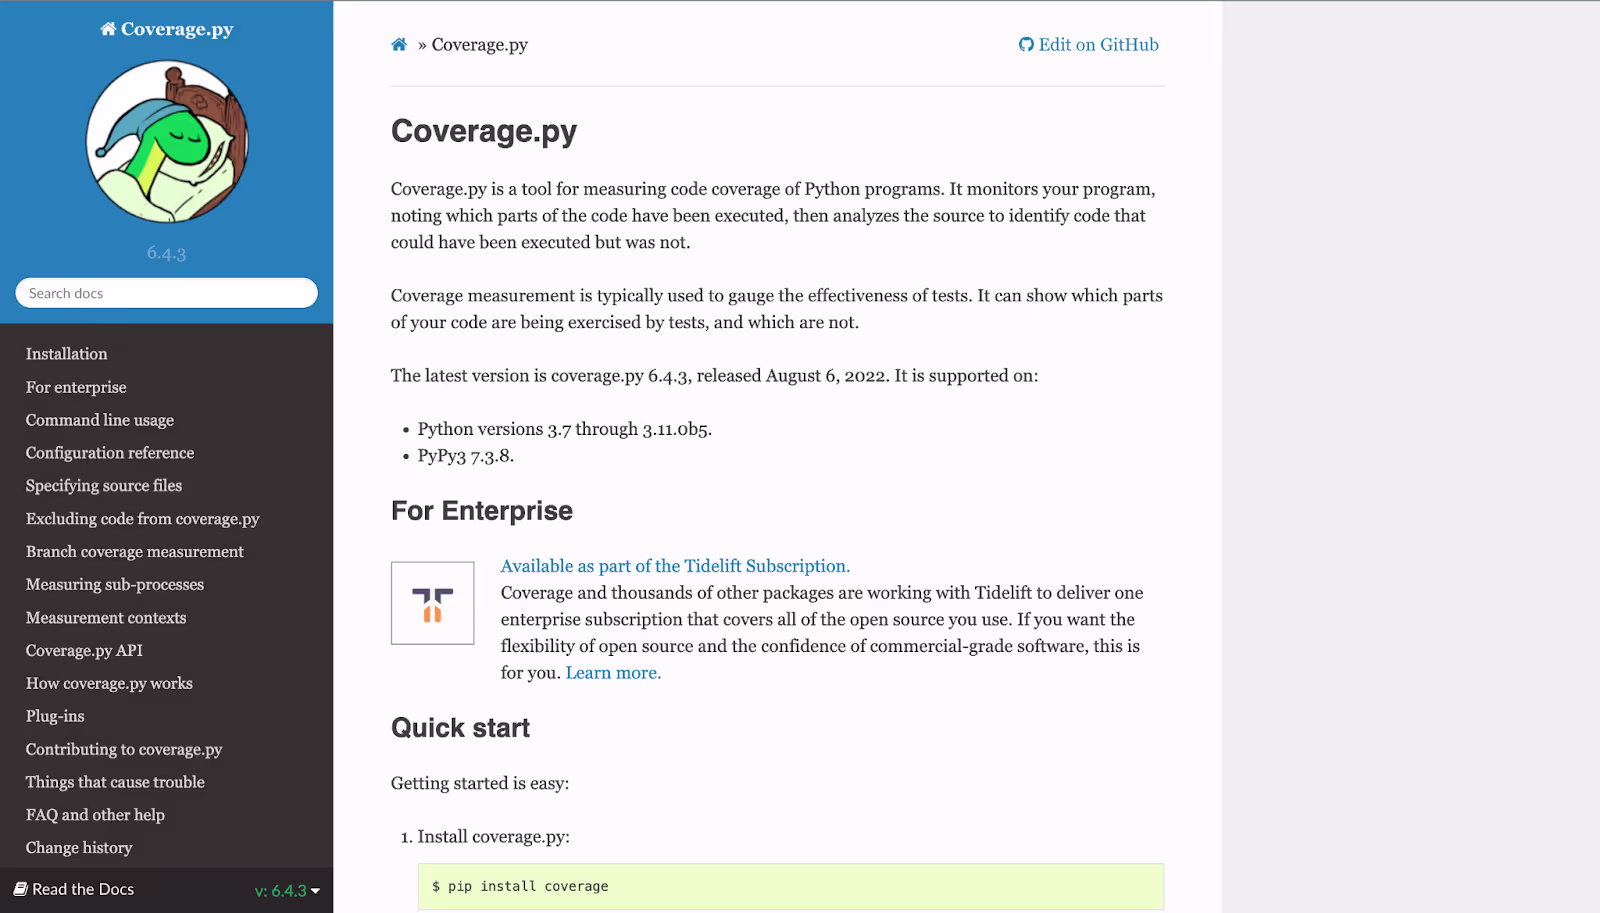 Coverage.py can measure line and branch coverage, as well as track dynamic contexts i.e., match the tests to the lines they were implemented against. You can choose to include information about the tests’ contexts in the coverage reports with simple commands. The tool also has an API for developers interested in exploring Coverage.py further.
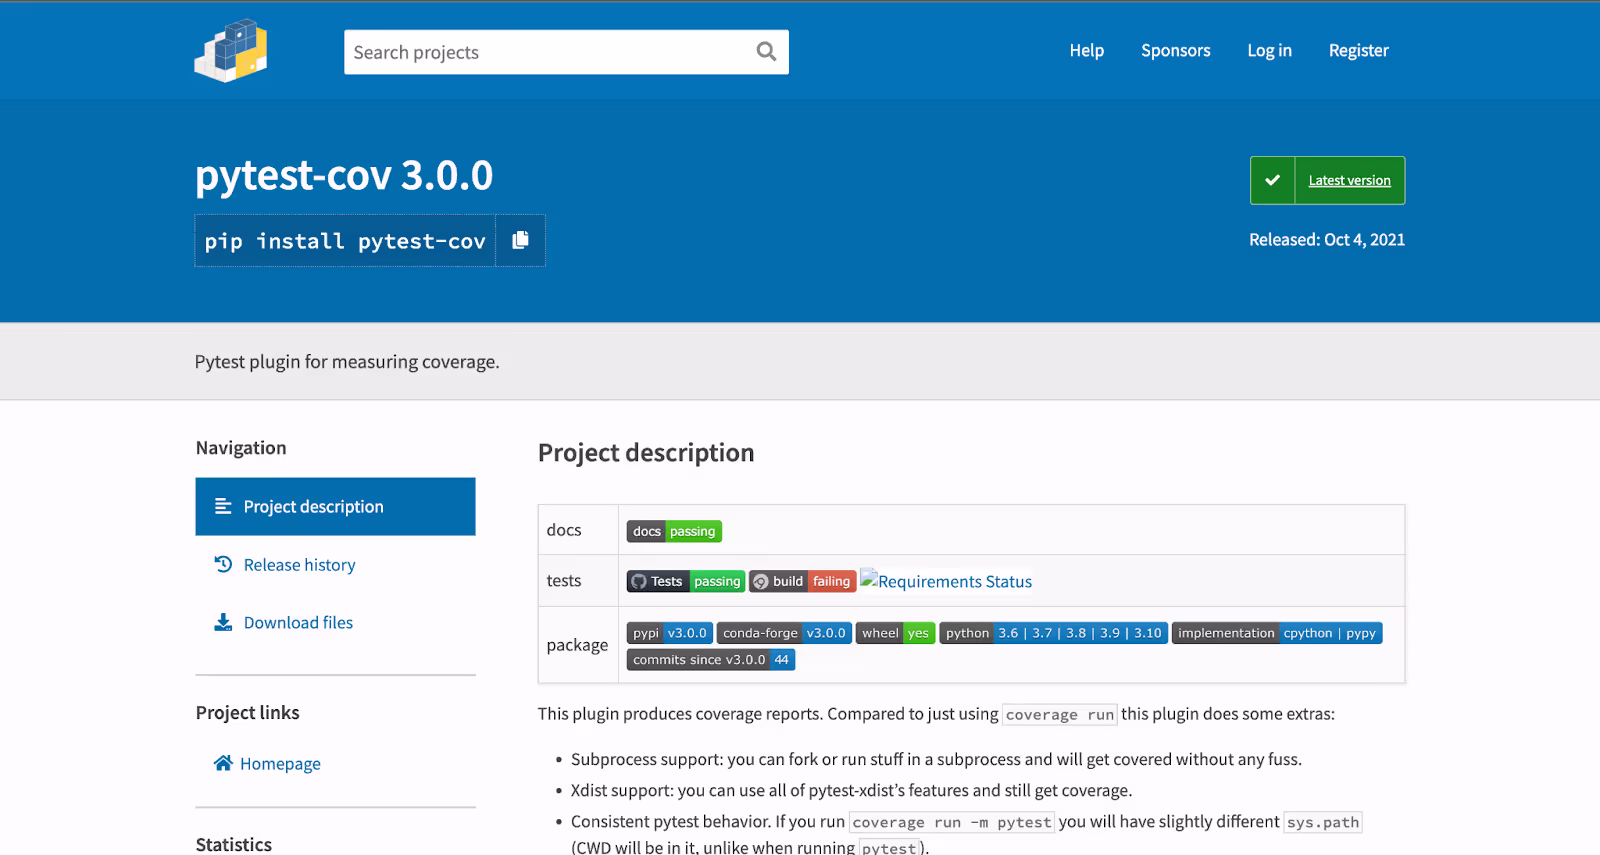
pytest-cov
pytest-cov is a plugin that Python developers can use to measure code coverage and generate coverage reports. It can be used to test code in subprocesses without any hassle, and also has support for distributed testing. The reports generated by pytest-cov can be viewed within the command line, in formats such as HTML, XML, or with annotations in the source code.
Code coverage in PyCharm
The professional plan for PyCharm includes a code coverage tool. It is an in-built feature of the IDE, which makes it easier for developers to run the analysis without having to install separate plugins or libraries.
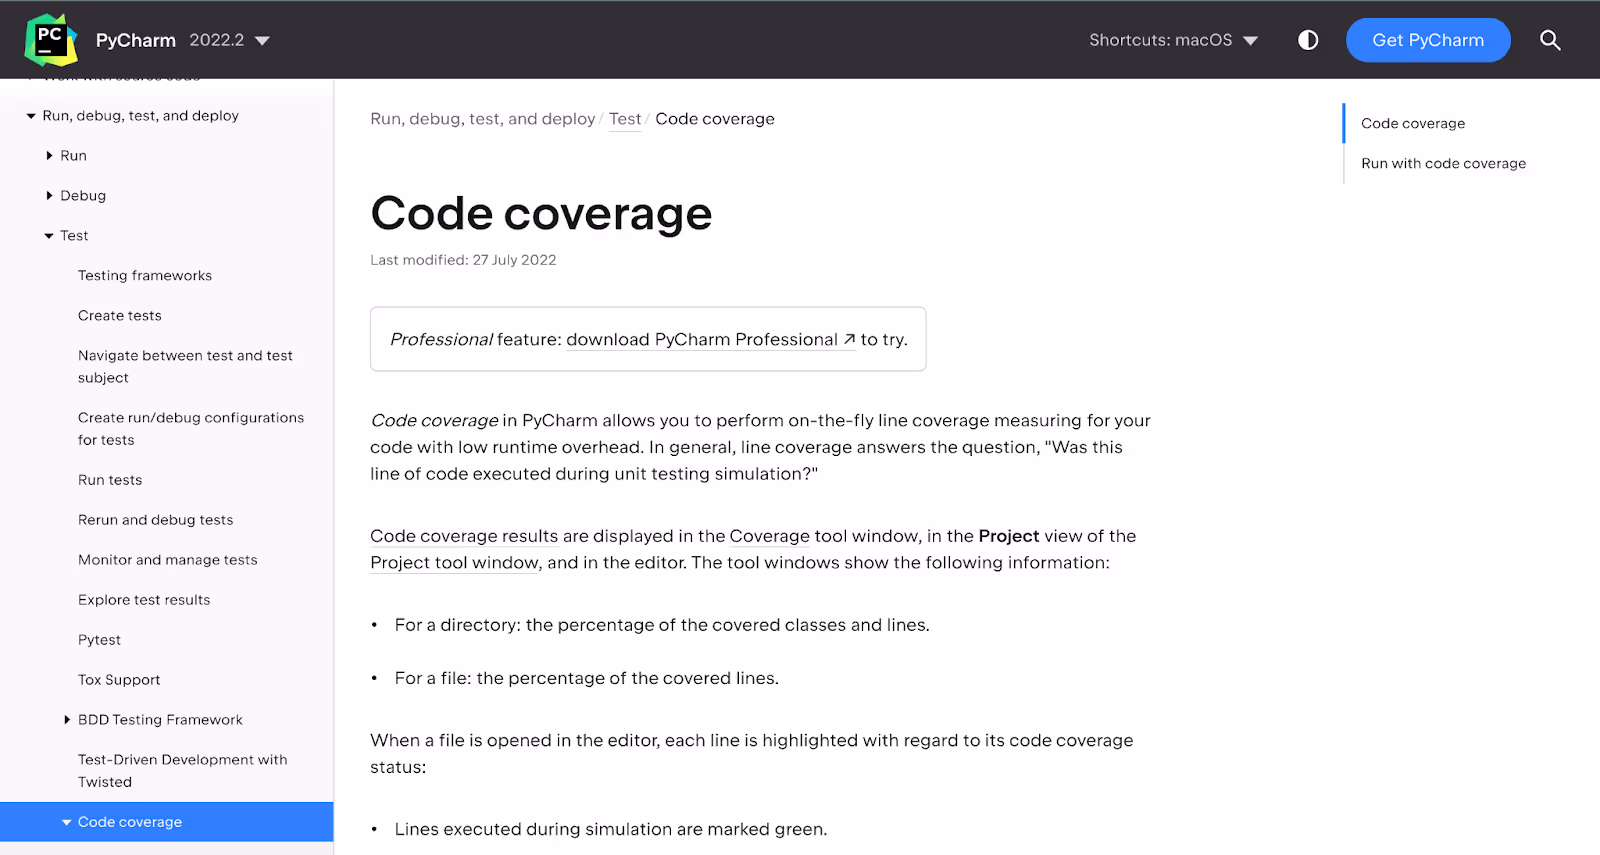 Whether the tool has scanned a directory or a file, the output is visible in a separate Coverage window, in Project view, as well as in the editor. Files opened in the editor are highlighted to help developers visualize which statements were tested during the coverage process and which ones remain untested.
Upon running a test with code coverage, a coverage suite is created. There is no limit to the number of suites you can have. You can either use a suite, take a look at the results of the coverage, or generate a report from it. PyCharm’s code coverage offering makes it convenient to run and incorporate into your workflows. The downside is that this feature is not available on either of its free plans.
istanbul
istanbul is a powerful Javascript code coverage library that is easily configurable. In addition to statement coverage, it also supports branch and function coverage. You can make use of the command line as well, including to perform code coverage measurement while running node.js unit tests without having to rely on the test runner.
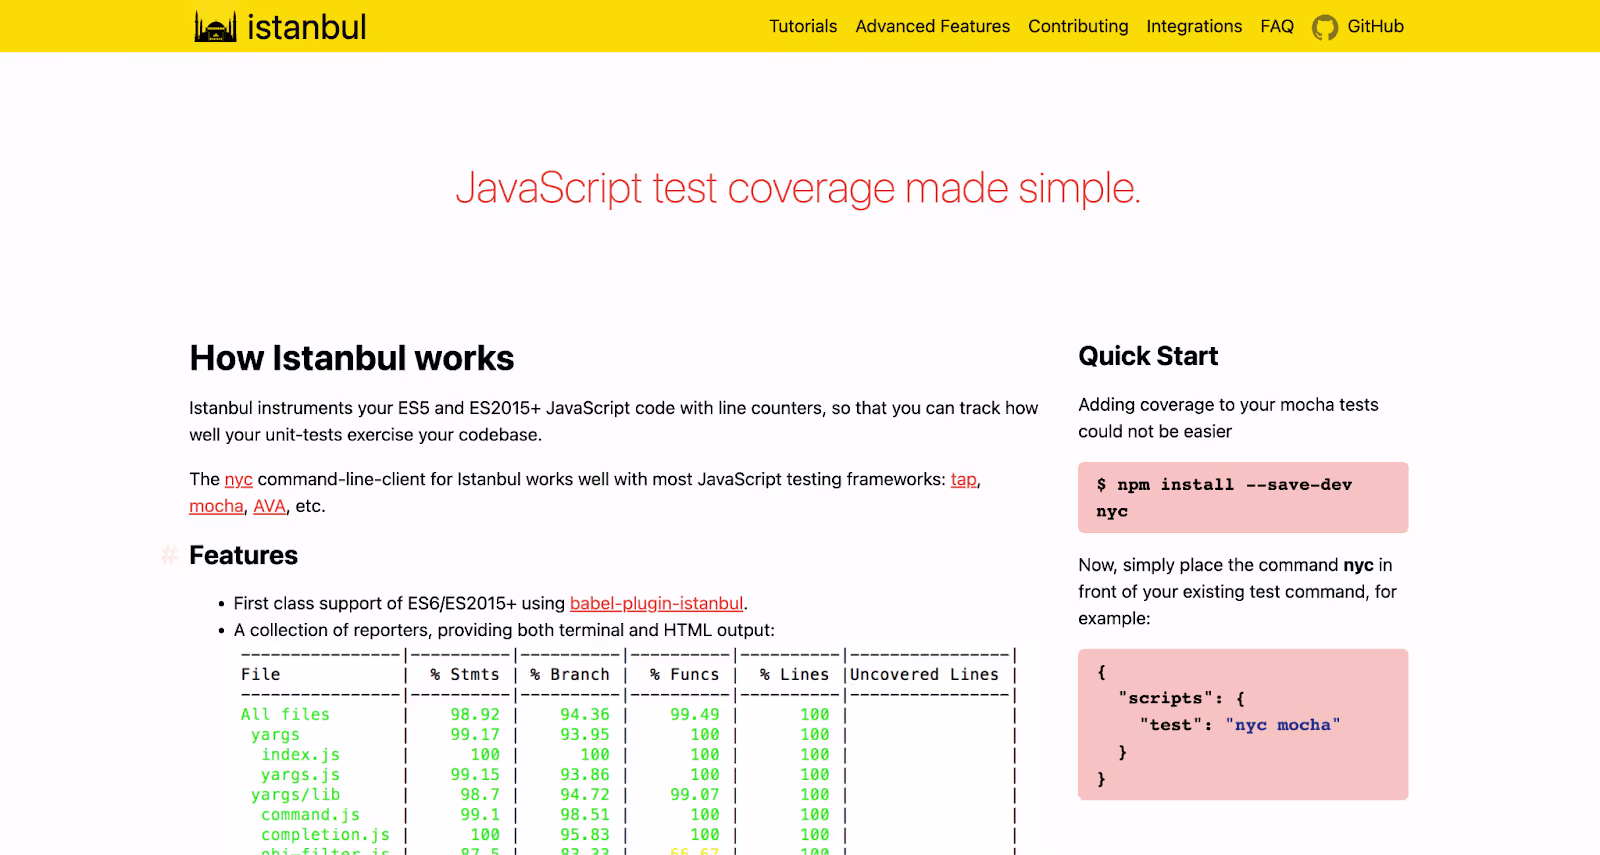 Its command line client, nyc, is compatible with a range of testing frameworks such as mocha, AVA, and tap. Additionally, it generates coverage reports, which are available in HTML and LCOV formats inside a coverage folder in the project environment.
JSCover
Javascript developers can also use JSCover to measure code coverage in their software. JSCover is a free tool that inspects line, branch, function, and condition coverage through a browser. It is compatible with all browsers and can run multiple tests simultaneously.
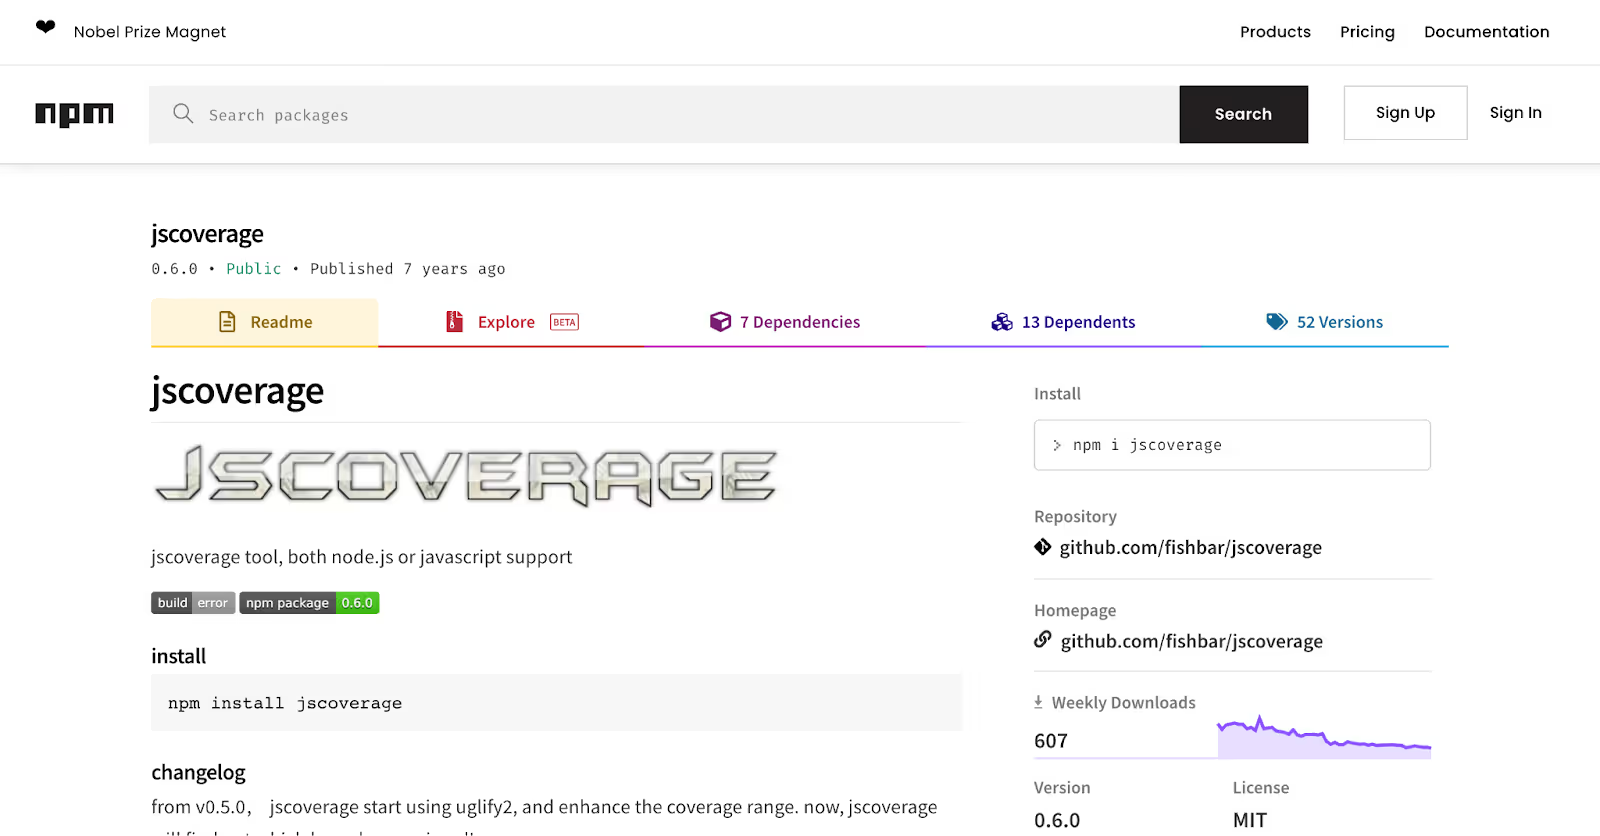 The reports can be saved in file-system mode and the data from multiple coverage reports can be merged for easier visibility. Its usefulness also stems from its ability to run as a web server, a file system, and a proxy server. It is meant to be a straightforward tool that can offer code coverage support for any programs running on Javascript.
SonarQube
SonarQube is a widely-used static analysis tool that helps teams prioritize code quality and security. Although it does not offer code coverage measurement services itself, it has support for the integration of code coverage data and reports generated by third-party tools.
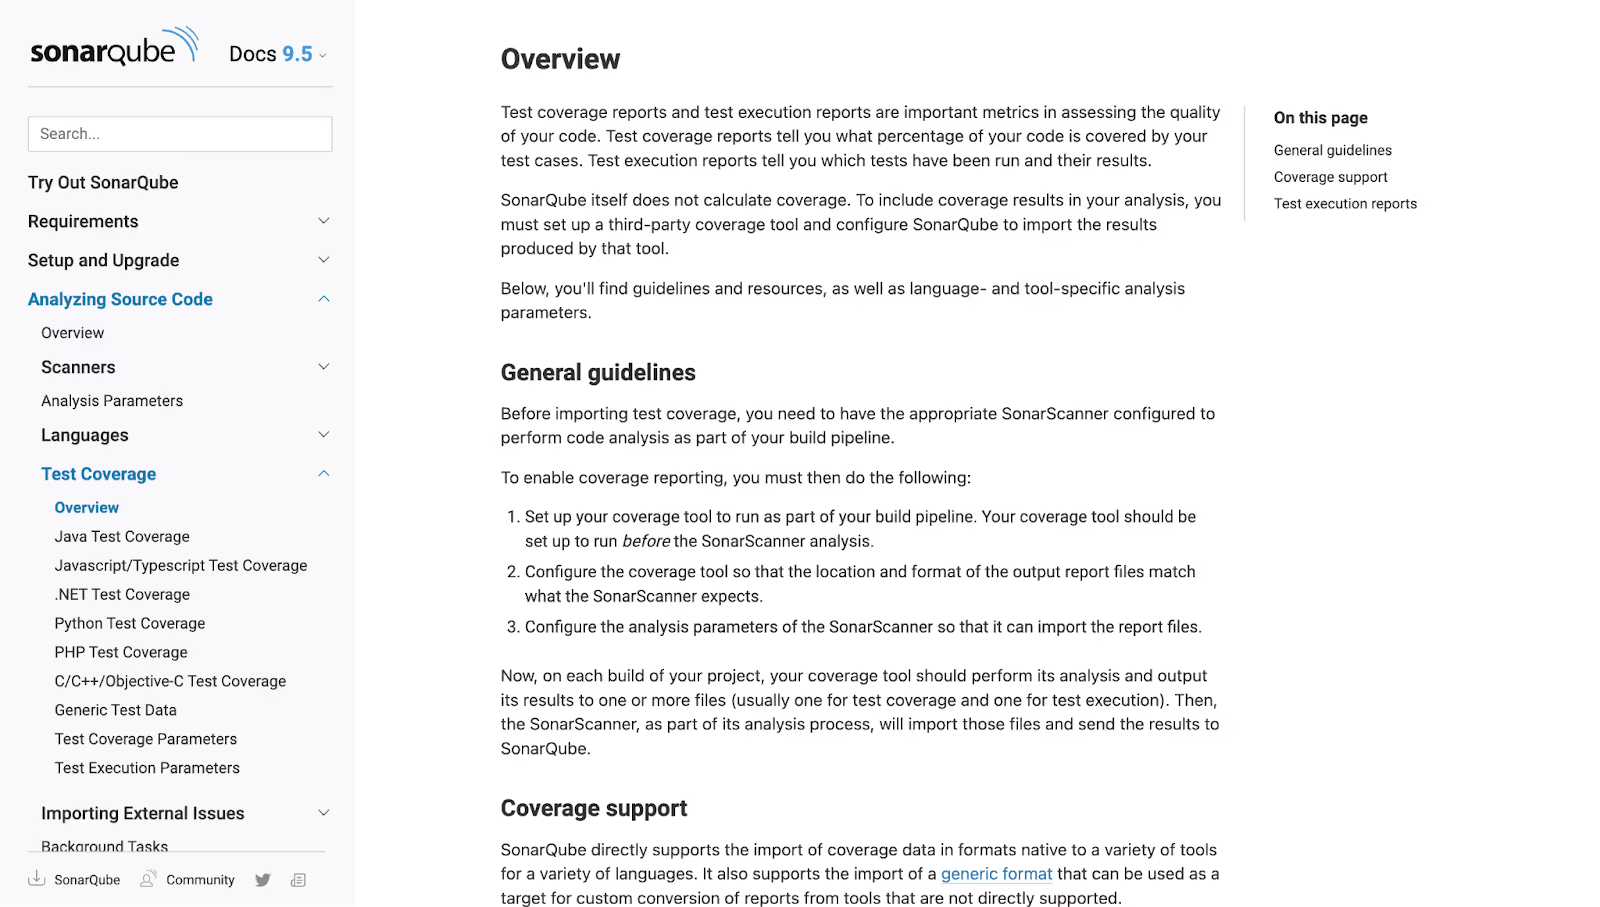
The code coverage tool must run in your build pipeline before the SonarQube analysis. After you import the results, SonarQube will take over to display the coverage results along with static analysis performance so that developers have access to these metrics in one place.
SonarQube supports coverage output from tools in multiple different languages, such as C, C++, JavaScript, Java, PHP, and Python. It also allows you to import the data in a generic format if you are trying to import results from other tools.
Cortex
Like SonarQube, Cortex’s service catalog can help give your team a comprehensive and detailed view of each microservice in your architecture. The catalog offers visibility into various aspects concerning the microservices, including their performance. Coupled with data on code coverage and quality, this equips developers to make informed decisions about the next steps in the development process.
Because Cortex supports integrations with tools like Codecov and SonarQube, code coverage data can be imported and used to set up scorecards. These scorecards can be based on certain rules concerning coverage and quality, and be used to measure these aspects of your source code.
Code coverage measurement is a simple yet effective practice to integrate with your software testing process. The tools highlighted in this guide are easy to set up and run. You don’t want to miss out on improving code and testing quality based on the actionable insights they will produce for your teams.


