
Engineering leaders are accountable to shipping quality products on time and within budget. But a CEO's historical understanding of engineering operations has been pretty opaque: ships on time, or doesn't. And although DORA metrics are a good place to start, they don’t offer the complete picture needed for CEOs.
With new tooling to support greater engineering efficiency, CEOs are learning that it's possible to get a richer picture of engineering productivity, quality, and velocity. They're now asking to see a new set of metrics, in order to ensure every part of the business—including engineering—is operating at maximum efficiency.
In this post, we’ll cover the three main metrics that CEOs are now asking for, and how engineering organizations can support these requests with the right reporting tools.
Why are CEOs asking for new metrics?
Wanting information on engineering productivity isn’t new, but the audience and metrics have evolved over the past few years. According to intel from The Pragmatic Engineer, companies like Amazon, Facebook, Uber, and GitLab have historically had internal dashboards geared at eng leadership and tracking things like code changes (although this is a controversial metric, and there’s ongoing debate about what metrics to track).
Today, with a focus on cost-cutting and efficiency due to macroeconomic trends, it’s not uncommon for CEOs to become champions of new engineering metrics programs—which is exactly the case with Uber’s CEO, as The Pragmatic Engineer reports. Crucially, it’s becoming easier for even non-technical CEOs to understand and ask for these metrics, because tools focused on eng metrics are becoming more available outside of internally-developed solutions.
Good metrics from engineering help CEOs keep their finger on the pulse of engineering progress and costs, so they can identify where bottlenecks and slowdowns are occurring. This allows them to improve processes and help teams iterate faster to deliver revenue-generating platform enhancements.
What are the three new metrics?
CEOs are now asking for metrics around 1) velocity, 2) quality, and 3) efficiency. These metrics are best viewed in aggregate, as averages across teams, product lines, and regions. They’re indicators that should be used to improve processes, costs, and investments—rather than punish individuals. Keep in mind also that the specific metrics that follow are examples, and things might look a bit different at every company.
1. Velocity: Timeline adherence over the last 4 quarters
Normally eng leaders report things like story points completed or delayed, but today, CEOs want more context than just a binary “hit the deadline or didn’t.” Measuring timeline adherence over the last 4 quarters is a better way to assess efficiency gains or loss over a longer time horizon, and whether changes to the team/processes are helping or slowing them down.
Tools that provide Gantt charts for project management, like Jira, can be used for this kind of timeline tracking, as long as they’re kept updated with the true dates of when different stages of the project are completed.
2. Quality: Production risk/readiness by product line
Quality should always be the focus of what you measure—but that’s only really possible when you agree on what “good quality” means as an organization. Engineering might normally measure quality in terms of defects per lines of code or changes made, but that's out of context for the CEO. Instead, they typically want to keep tabs on what’s at risk for each product line, using higher-order metrics they can understand at a glance.
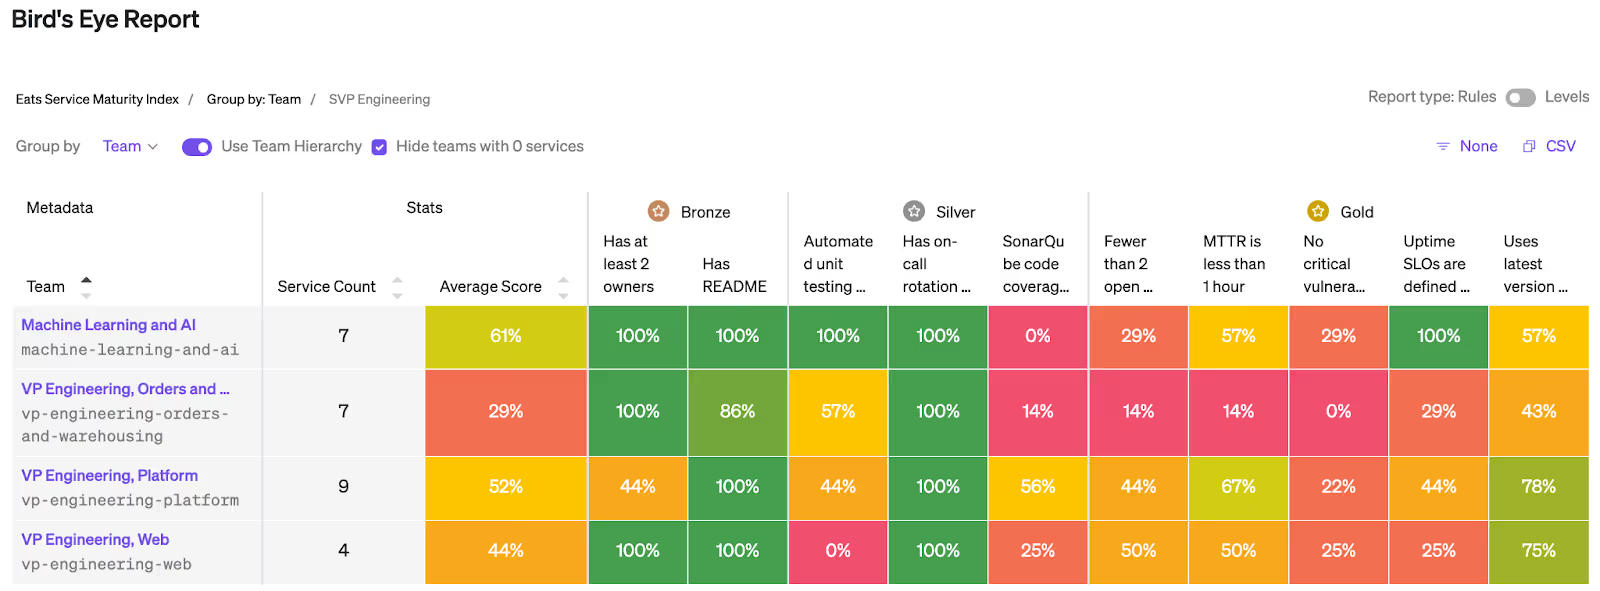
IDPs like Cortex make it easier for CEOs to get this kind of reporting. You can use Cortex scorecards to measure operational excellence and ensure best practices are being followed for key areas such as security, service ownership, and production readiness. At the CEO / executive leadership level, identifying areas of risk is critical to success. Within Cortex, you can define product lines or business functions as domains and easily generate a report of production readiness scorecards in the green/red broken out per domain or team.
3. Efficiency: Cost insights by product line supported
CEOs want to know how much it costs to support a product line, including aspects like deployment, troubleshooting, and long-term maintenance. This is a newer metric that’s typically more difficult to calculate manually, especially when you want to view it alongside velocity and quality metrics. When you ship faster, do costs go up or down? Do higher-quality product lines cost more or less to build and maintain, and how does this track over time?
With the Cortex plugin framework, you can feed any data source into Cortex and use it to add additional insights to your scorecards and reports. By building a plugin to your revenue and expenditures tables, you can visualize the "value" of product lines in the context of their performance on particular scorecards.
With an IDP like Cortex, CEOs are better equipped to understand how engineering productivity affects the bottom line. To learn more about how Cortex can help your organization, schedule a demo today.


