There are a lot of ways to gauge the performance of your DevOps teams and the health of your software, but DORA metrics have emerged as the industry standard. If you aren’t familiar with DORA metrics, take a few minutes to read this comprehensive guide to understanding DORA metrics.
DORA metrics were designed to offer a high-level, long-term view of how your teams are performing. However, they weren’t developed for passive tracking — instead, DORA metrics should encourage developers to proactively improve their processes. It’s only natural, then, that as a platform built to promote a culture of accountability, Cortex is uniquely equipped to help you make the most of DORA metrics.
Through the use of Eng Intelligence, CQL expressions, and integrations, you’ll be able to easily gain insights into your team’s performance and build a Scorecard in Cortex that helps your teams reach their goals. In this article, we’ll give you some suggestions for creating a DORA Scorecard for your organization.
Tracking DORA metrics in Eng Intelligence
When you’re setting DORA metric goals, Eng Intelligence in Cortex helps you see the reality of how your team is performing and where they can improve.
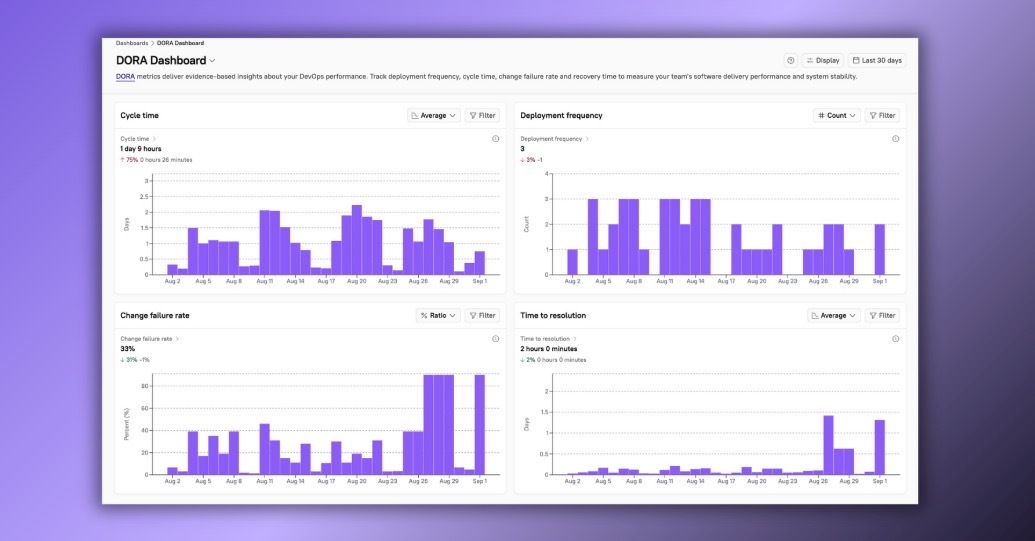 Eng Intelligence pulls in real data from your workflows (cycle time, deployment frequency, change failure rate, and mean time to restore) and maps them to team-level activity. Visualize whether long cycle times are being driven by review delays, or if a drop in deployment frequency ties back to larger PR sizes.
With this visibility, your teams can track their progress against industry benchmarks, understand what’s holding them back, and set targeted goals to improve. The key isn’t just measuring DORA; it’s using Eng Intelligence to turn metrics into actionable insights, so that teams can continuously optimize delivery speed and reliability while aligning to organizational goals.
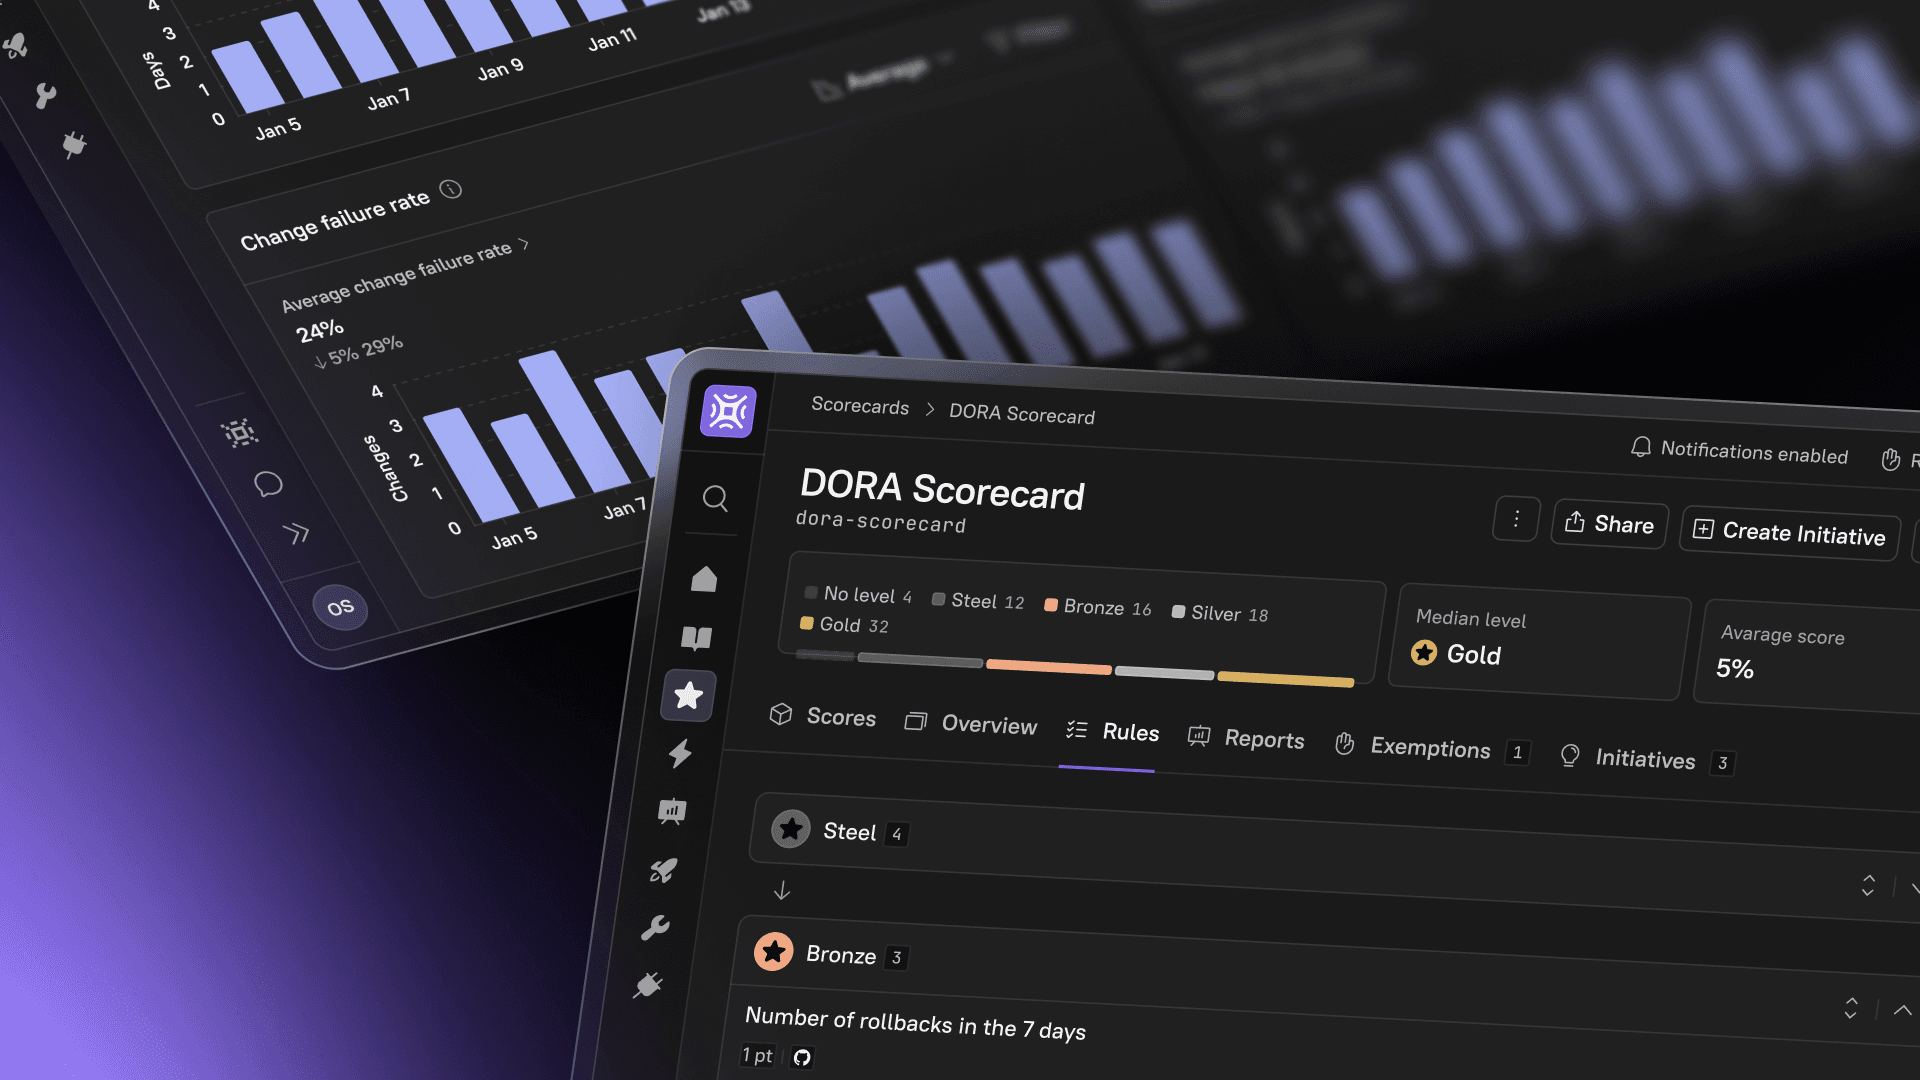
Use these insights to understand your baseline performance and create Scorecard rules targeting achievable improvements.
Deployment frequency
Deployment frequency measures how frequently your teams are shipping changes. To track deployment frequency in Cortex, you’ll first need to integrate with your deployment pipeline. That integration feeds into an event timeline within Cortex, so you can access all of a service’s deploys in a single place.
Once your deployment pipeline is hooked up to Cortex, you can begin querying against this data and creating Scorecard rules. Keep in mind that DORA metrics are designed to be evaluated over time — it’s not about hitting a goal once, but consistently maintaining a certain level of service. When you’re crafting your rules, you want to set an attainable goal that will motivate team members to improve.
For example, you may choose to set a deployment rule of “Averaging 1-4 deploys per month.” This window of time is long enough to be meaningful, and recent enough that it accurately reflects performance. Because this metric relies on custom data, a custom CQL expression is needed to set the rule:
deploys(lookback = duration("P1M")).length >= 1 and deploys(lookback = duration("P1M")).length <= 4By creating a Scorecard rule, you’re not just tracking this invaluable data — you’re setting standards for your organization and giving your developers a clear goal to work toward. With all of these metrics, it’s crucial that you consider your unique teams and product, and set a goal that makes sense for your organization.
Mean time to recovery
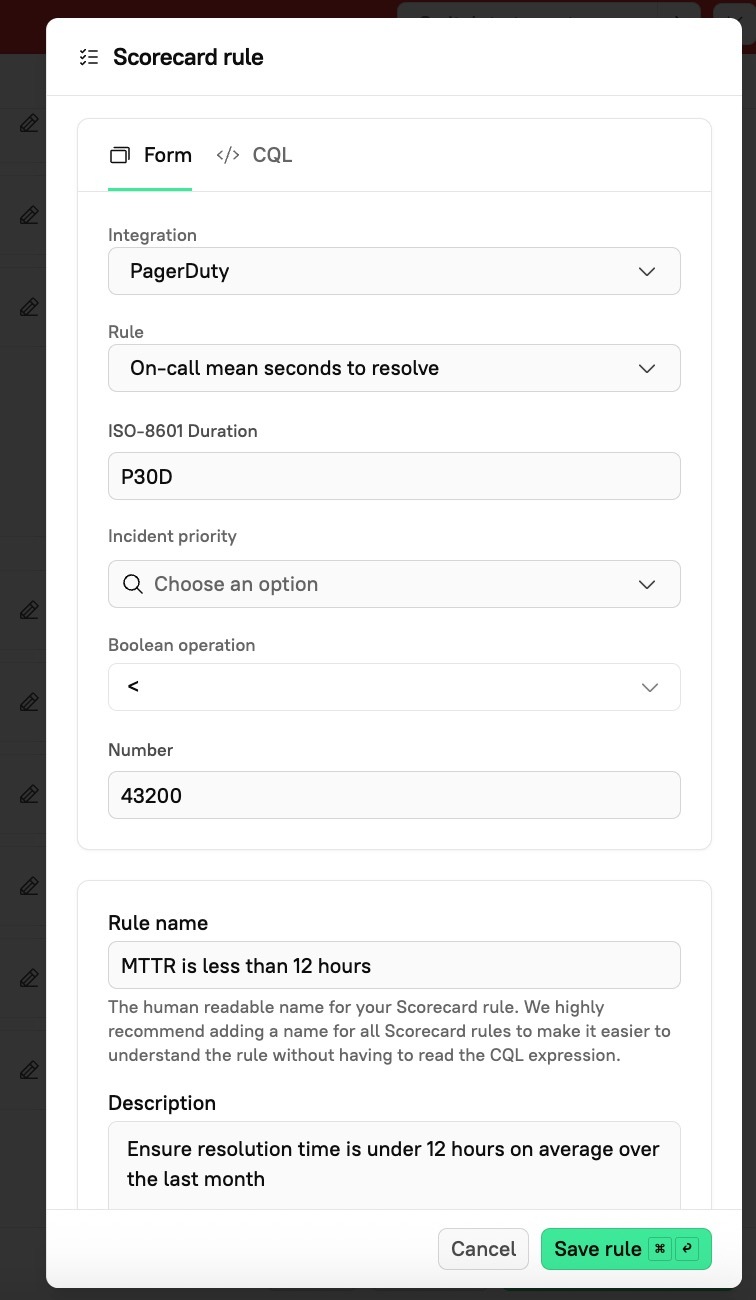
Mean time to recovery (MTTR) is the average amount of time it takes your team to restore service when there’s an incident. To track MTTR in Cortex, you’ll want to integrate with PagerDuty.
Using PagerDuty, you can create a rule for MTTR without using CQL. Instead, build it via Cortex’s UI to set rules according to your specifications.
Let’s say your MTTR rule is “Incident was resolved in less than 12 hours,” and it is set to examine the average over the last 30 days. The UI will provide you with fields for duration, binary operation, and number— you’d simply enter P7D, <, and 1.0, respectively. Cortex will handle it from there.
 Just like with deployment frequency, you want enough of a lookback window that the metric is reflective of current performance and is specific to your organization. That might be a week, two weeks, or longer — it all depends on what makes sense for you and your teams.
You can also use the simple form builder to create rules for other important metrics, such as mean time to acknowledge (MTTA) — how long it takes your team to acknowledge that an incident has arisen.
Change failure rate
Change failure rate represents the percent of changes or releases that result in downtime, degraded service, or rollbacks. With your deployment data in Cortex, it’s easy to find the ratio of rollbacks to deploys, which is your change failure rate.
For example, a change failure rule could be “Ratio of rollbacks to deploys in the last 7 days” with a goal of less than 30%. Just like with deployment frequency, this metric is using custom data, so this would require a CQL expression:
deploys(lookback=duration("P1M"),types=["ROLLBACK"]).length / deploys(lookback=duration("P1M"),types=["DEPLOY", "ROLLBACK", "RESTART"]).length < 0.30
Because you also have your whole event timeline in Cortex, you can filter on specific types of rollbacks and deploys to get a more granular look. You can tag events to distinguish between automated and failure-based rollbacks, and filter your query accordingly.
With this metric in particular, consider whether you want to set a specific goal or promote a particular outcome.
Change failures are inevitable. Promoting a goal of 0% failure may lead developers to work more slowly or release fewer changes, so you may incentivize the wrong behavior in the process.
You might evaluate how many of your rollbacks were automated and how many were manual. If the majority of your rollbacks are automated, that might indicate your teams are leveraging good tools that quickly detect outages, roll back changes, and improve your MTTR in the process.
Lead time for changes
Lead time for changes measures the amount of time between a commit and production. Like deployment frequency and change failure rate, you’ll use deploy data to track this metric in Cortex.
To get lead time for changes, you can push relevant data into Cortex along with your deploys by including metadata about when a pull request was first opened. You can then query on the deploys that took more than a week to deploy into production, for example. By tagging your deploys with that event data, you can get more granular insight into your services.
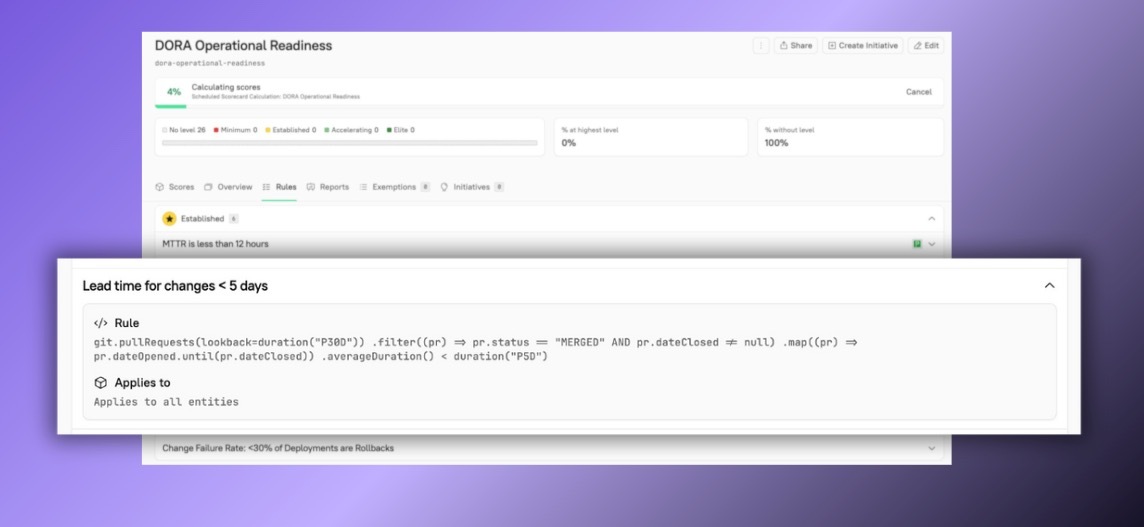 For example, the following CQL rule looks at merged PRs from the last 30 days, pulls the average duration between the PR’s open date and closed date, and ensures that the duration is less than 5 days:
git.pullRequests(lookback=duration("P30D"))
  .filter((pr) => pr.status == "MERGED" AND pr.dateClosed != null)
  .map((pr) => pr.dateOpened.until(pr.dateClosed))
  .averageDuration() < duration("P5D")
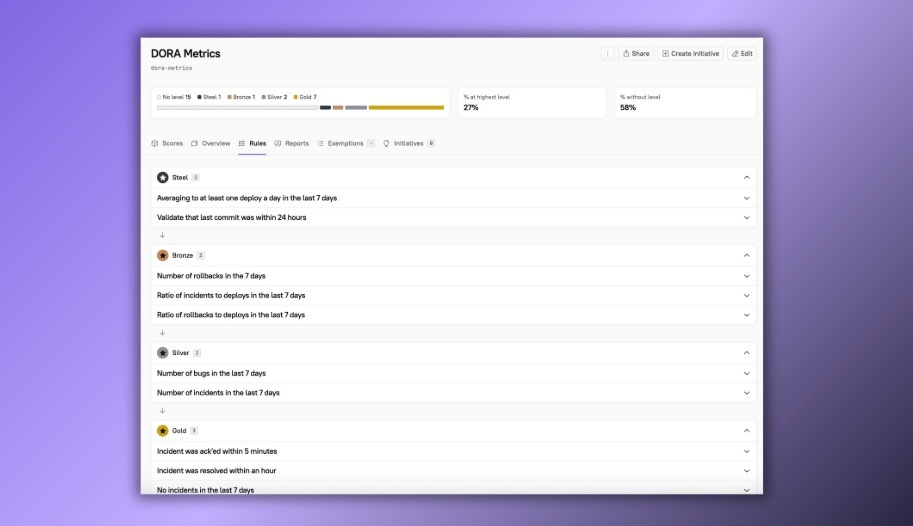
Using ladders to set goals
Google’s DORA team conducted a cluster analysis to identify four industry-level performance categories: elite, high, medium, and low. In the Accelerate State of DevOps Report from 2021, the DORA team outlined how teams at each level perform under each metric. For example, when it comes to MTTR, elite teams restore service in less than an hour on average, while medium performers take anywhere from a day to a week to restore service.
If the industry standards that the DORA team outlined make sense for your DevOps team, then you can easily use Cortex to encourage your team to advance from low- or medium-performers to high- or elite-performers. If these standards don’t quite apply to your team, you can use Cortex in the same way, but set goals that are appropriate for your team.
To promote movement toward a goal, you can iterate the same rule with different thresholds and use ladders to represent that progress. This not only makes it super clear to developers what the priorities are, but it gamifies the process of improvement.
Let’s say, for example, that your team’s current change failure rate is 15%. That’s low enough that your DevOps team is considered an elite performer by DORA standards, but you know that your team can do better. To target this metric with a ladder, begin by writing a rule that sets a goal of 10%. Then, create another rule that sets the threshold to 5% instead of 10%. You can repeat this process until you’ve added a rule that represents each level of improvement. Once that’s done, it’s time to create a ladder. In this example, the first level would include our 10% goal, and the second would have our 5% goal.
Rules and ladders give you even more power to incentivize the right behavior and encourage progress over time. Because these features are completely customizable, you don’t have to stick with the industry standard. With Cortex, you can track DORA metrics in a way that’s actually meaningful to your organization and sets actionable goals, so you’re not idly monitoring metrics without taking the right steps to improve performance.
Start using Cortex today
To make it as easy as possible for Cortex users to set up their own DORA metrics Scorecards, we’ve set up a template Scorecard that takes care of most of the manual work for you, including generating a ladder. And, as with everything else within Cortex, the Scorecard template is fully customizable, so you can make any adjustments you need to.
 This is just the beginning of what Cortex can do to unlock DORA metrics for your organization.
With the power of reporting, you can gain even clearer insight into performance across your organization. By grouping the Bird’s Eye report by team, you can quickly see who is meeting standards and who isn’t.
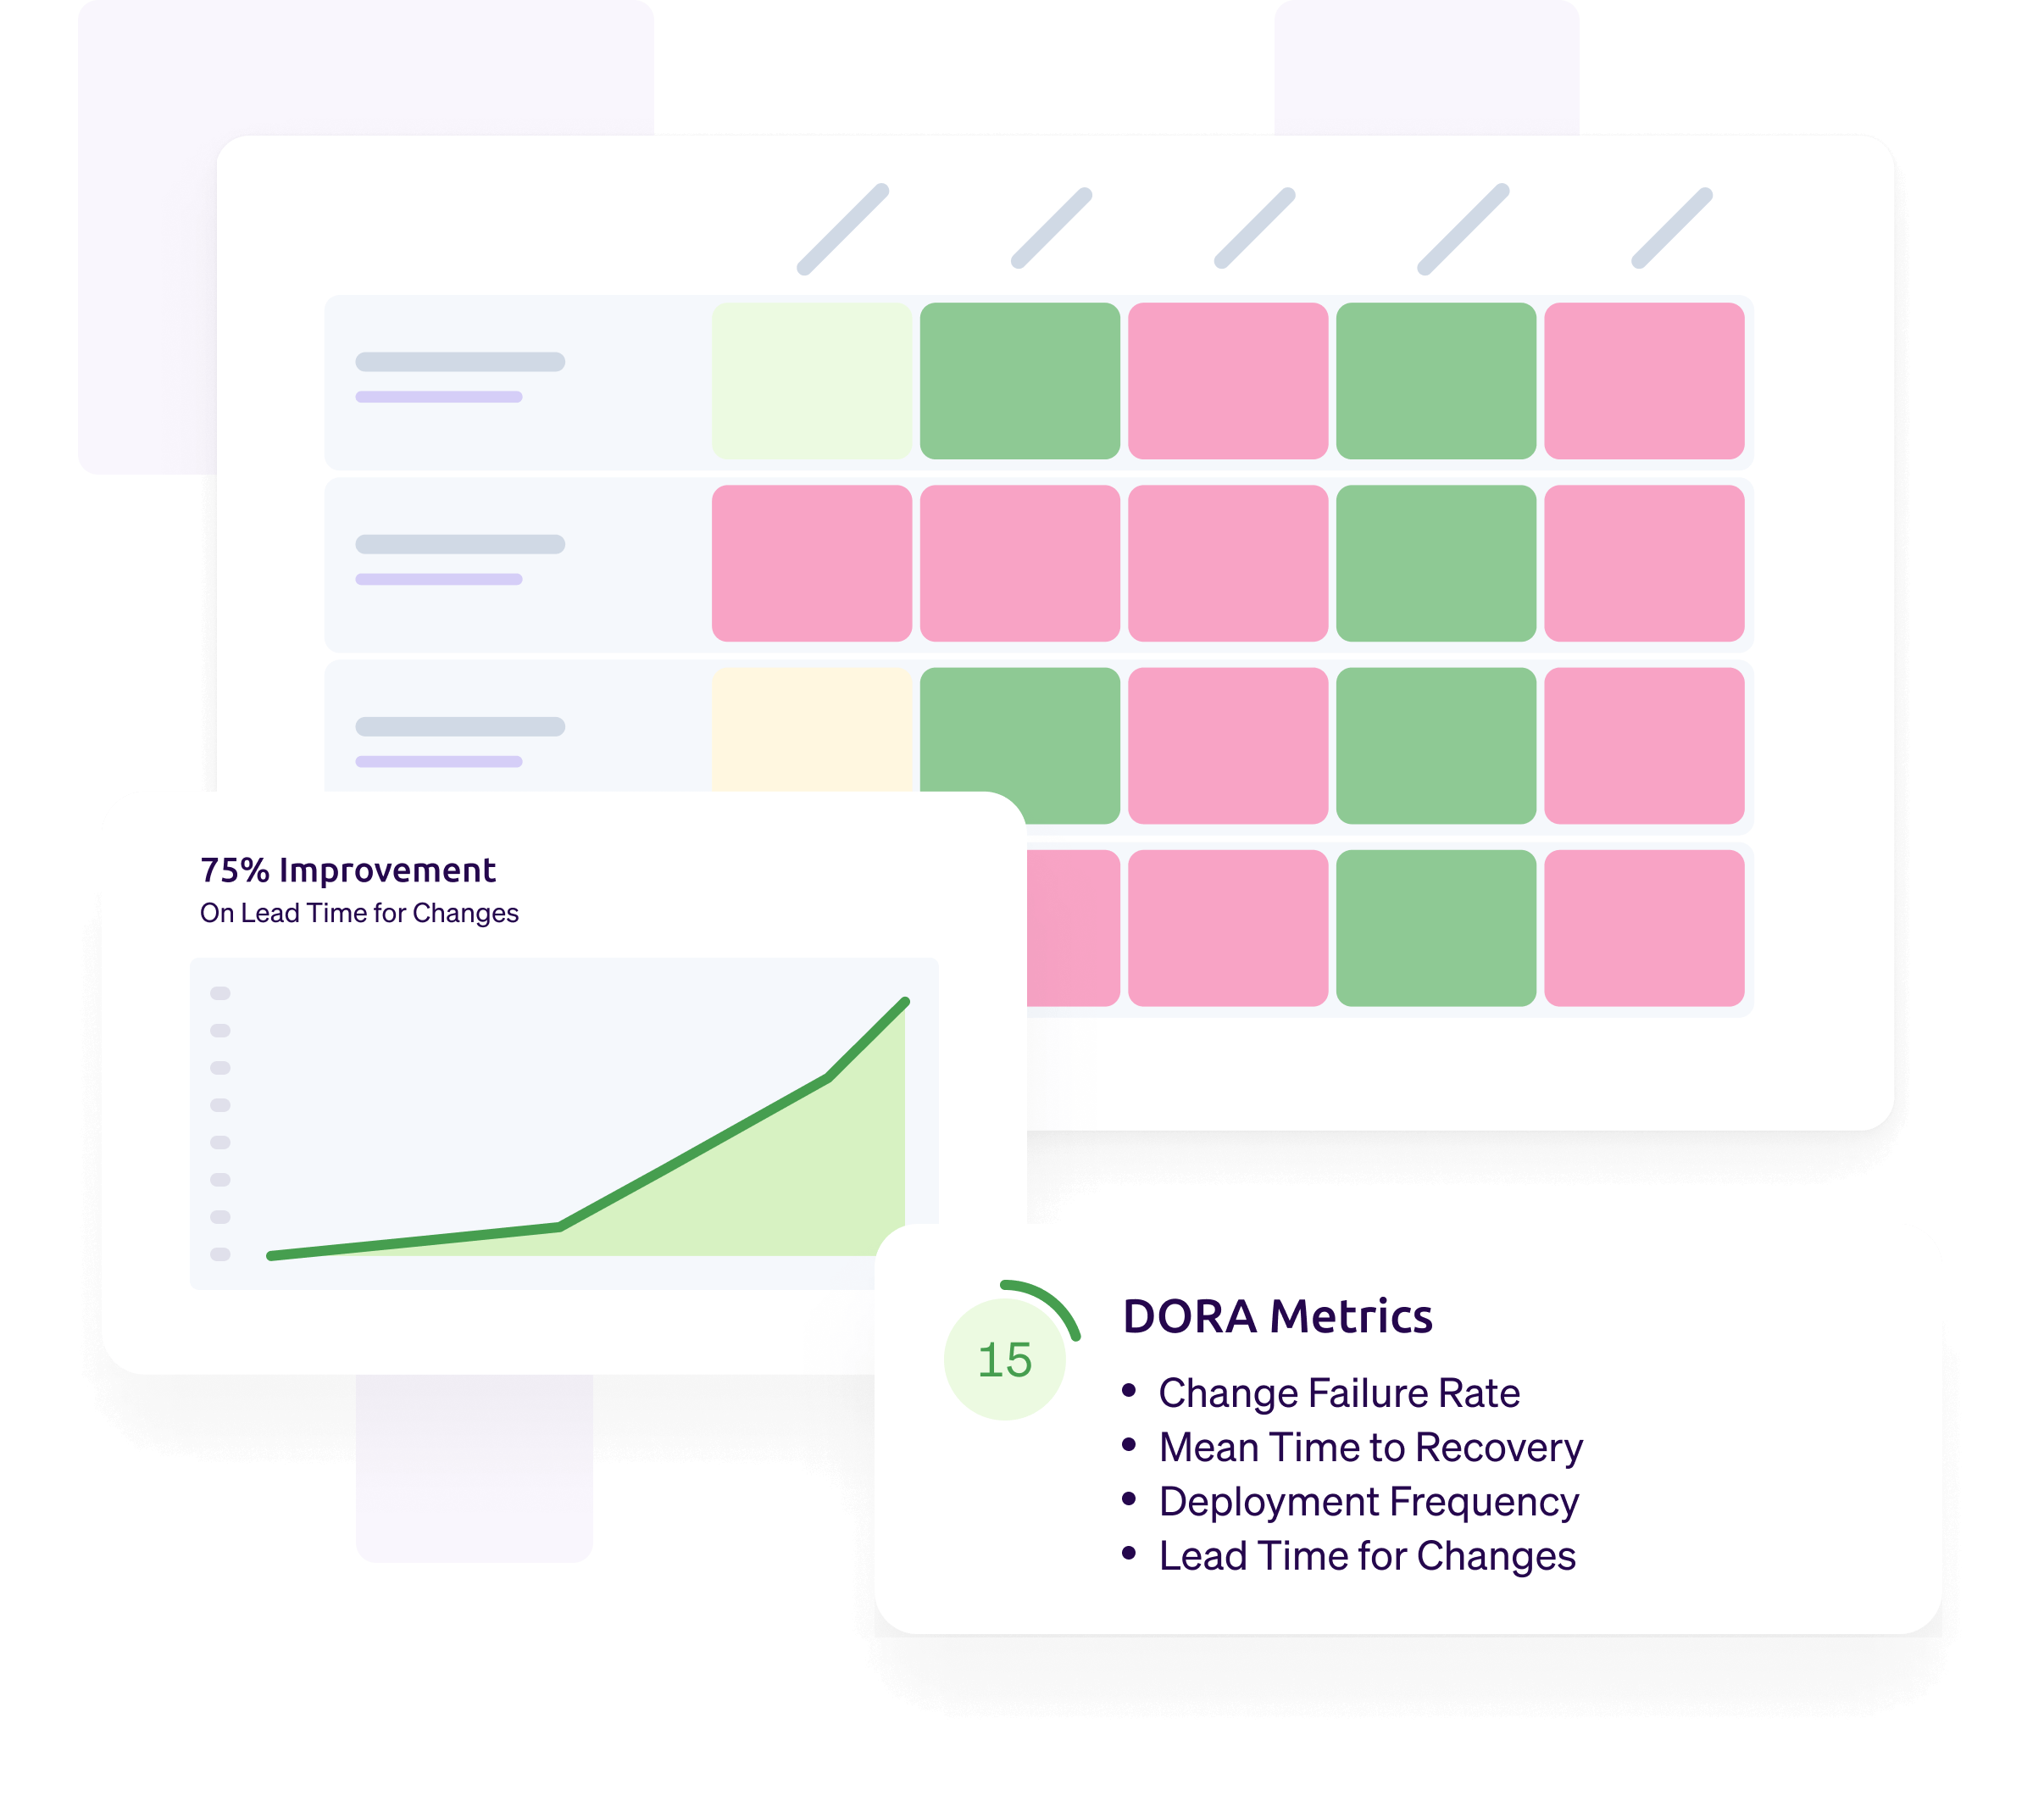 This kind of data aggregation makes it easy for engineering leaders to drive progress across all four DORA metrics. Out of the box, Cortex has the integrations and tools you need to make the most of the invaluable insights offered by DORA metrics.
Start using Cortex to gain the visibility you need into your services so you can deliver the highest quality software your teams are capable of. Book a demo today so you can see the power of Cortex for yourself.


