

Key Takeaways

AI coding assistant ROI is the net value of delivery gains, minus the fully loaded cost of the tools, weighed against what happens to reliability, security, and code quality. Express it relative to what you spend on AI.
Lines of code, acceptance rates, and "time saved" measure tool activity. They can't tell you whether accepted code passed review, shipped, or caused incidents.
Licenses, tokens, and training are hard dollars you can count. Reliability, security, and quality are signals to weigh against the gains, and forcing them into dollar figures weakens the analysis.
Token-based pricing means cost scales with usage, so a budget built on seat count will drift from actual spend as adoption grows.
Measure at the team level: baseline before adoption, compare similar teams, and review on a recurring cadence. Early results often dip before gains show up.
The DRIVE framework, Cortex AI Impact, and the OpEx Review Agent put delivery, cost, reliability, and security signals in one regular review, so leaders can act on what the data shows.
Most engineering organizations now run AI coding assistants at some scale, and GitHub Copilot, Cursor, and Claude Code have become standard line items in the tooling budget. As those licenses come up for renewal, finance wants to know whether the spend is producing better engineering outcomes or just activity that looks productive and never shows up in the results.
The metrics most readily available don't answer that question. Vendor dashboards report lines of code generated, suggestions accepted, and estimated time saved, all of which describe how much developers use the tool. An accepted suggestion still has to survive code review, pass tests, ship, and run in production without causing an incident, and the dashboard stops counting at acceptance.
That gap matters more as AI makes code cheaper to produce. Code is no longer the bottleneck; the constraint is whether the organization can review, ship, operate, and govern everything its assistants generate.
Answering the renewal question means measuring the value of delivery gains against the fully loaded cost of your AI tools and checking whether reliability, security, or code quality slipped along the way. ROI is the net value of those gains relative to what you spend on AI. You can put dollars on the delivery gains and the tool costs, but reliability, security, and quality rarely convert cleanly, so ROI works best as a framework for judging the trade-off. Doing that consistently takes a model that ties AI tool spend to engineering outcomes, plus a recurring review to act on what it shows.
Why "lines of code" and "time saved" fail as ROI metrics
A developer who accepts most of what the assistant suggests looks like a power user on the vendor dashboard, even if none of that code survived review. Lines of code generated, acceptance rate, and completions per user all count interactions with the assistant. For the purpose of understanding whether the tool is being used, these numbers are fine. But a team's acceptance rate can climb in the same quarter its change failure rate does, and the vendor dashboard won't connect the two.
These metrics are also easy to inflate once developers know they're being tracked, since accepting a suggestion takes less effort than evaluating whether it belongs in the codebase. "Time saved" has a different flaw: it's usually a self-reported or modeled estimate, and vendor dashboards don't show where the saved hours went. If they went to reviewing and reworking AI output, the organization is producing more code and getting less net value from it.
A Dimensional Research survey for Flux found that 35% of organizations use AI to write code they never deploy, and 80% now spend at least 10% of engineering time on code review, much of it reviewing AI-generated output. GitClear's analysis of more than 600 million commits found that code duplication rose 81% between 2023 and 2026, while refactored code fell from 21% of changes to under 4%. The available data suggests that higher AI-assisted output volume does not reliably translate into better engineering outcomes, which is why the ROI question requires a different framing than what the vendor dashboard provides.
What a real ROI model for AI coding assistants looks like
ROI is the delivery gains AI produces, minus the fully loaded cost of the tools, divided by that cost. A team that spends $1 million a year on AI tooling and can credit $1.3 million in delivery value to it has a 30% ROI on paper. Before calling that a return, weigh it against what happened to reliability, security, and code quality.
DORA's 2026 ROI of AI-assisted Software Development report uses the same formula and traces value from AI adoption through organizational capabilities and delivery metrics to cost savings and revenue. Its authors frame the result as a high-uncertainty estimate for starting a conversation with finance. The caution is earned, since licenses, tokens, and training are hard dollars you can count, while reliability, security, and code quality are signals you can track but can't cleanly price. Forcing both into one spreadsheet cell undermines the whole analysis. DORA's public ROI calculator walks through the inputs step by step.
The return also depends on whether the organization can sustain those gains, with clear ownership, standards, review workflows, and operational context in place. Many organizations haven't built those yet. Cortex's guide to the five levels of the enterprise AI software factory warns that handing a coding agent to every engineer who asks multiplies code volume faster than CI, code review, incident response, and cost controls can absorb it, and that ownership gaps surface first. When that happens, faster delivery piles up risk faster than it produces value.
The gains: delivery outcomes, not activity
Cycle time, lead time for changes, deployment frequency, and throughput on completed work are the metrics that belong on the value side. Most engineering organizations tracking DORA metrics already have these, and they measure whether code is moving through the pipeline and reaching production faster or more frequently than it did before AI adoption.
Isolating the AI tool's contribution from other changes happening at the same time is the hard part. The basic approach is to baseline these metrics before or independent of AI adoption, then compare teams with higher and lower adoption levels on comparable codebases and workloads. Correlation between higher adoption and better delivery numbers does not by itself prove the tools caused the improvement, since higher-performing teams may also be the ones most likely to adopt new tooling.
The costs: the hard-dollar inputs
Most inputs on the cost side are countable: per-seat licenses, token and API usage overages, onboarding and training time, implementation and governance overhead, and the administrative cost of managing tool sprawl as teams adopt multiple assistants. The exceptions, like engineering time spent configuring and securing AI tools, require estimation rather than a direct invoice total.
The important development in AI coding tool pricing is the shift from flat per-seat licenses to consumption-based models where cost scales with usage. Gartner found that nearly a quarter of technology leaders already spend between $200 and $500 per developer per month on AI coding tokens, and about 6% spend more than $2,000 per developer per month. Gartner also noted that developers tend to optimize for speed rather than token efficiency, which means cost can rise faster than the productivity gains the tools provide. For organizations building a budget around AI coding tools, the implication is that a forecast based on license count alone will diverge from actual spend as adoption grows, and the consumption-based component needs its own tracking.
The risk discount: reliability, security, and quality as AI adoption scales
Google's 2024 DORA research found that as AI adoption increased, delivery stability fell by an estimated 7.2%. A year later, with 90% of respondents using AI at work, the 2025 DORA report found AI adoption tied to higher throughput and still tied to lower delivery stability. When Veracode tested more than 100 LLMs, 45% of the AI-generated code samples failed security tests and introduced OWASP Top 10 vulnerabilities. And in the Stack Overflow 2025 Developer Survey, more developers said they distrust the accuracy of AI tools (46%) than trust it (33%).
The indicators to track are change failure rate, incident volume, mean time to recovery (MTTR), rework and code churn, and security findings. None of them convert to dollars the way license costs do. A rising count of open critical vulnerabilities still means someone will eventually stop shipping features to fix them, and a climbing incident rate pulls senior engineers off planned work. A faster lead time that arrives with a spike in incidents is borrowed against that future work, and leaving these signals out overstates what the AI tools are worth.
How to measure AI coding assistant ROI
Measuring AI coding assistant ROI takes six steps: baseline before adoption, measure adoption by team, compare comparable teams and work, track delivery and risk together, review on a recurring cadence, and act on what the data shows.
1. Baseline before adoption
Capture the outcome and cost metrics you plan to track: cycle time, deployment frequency, change failure rate, incident count, MTTR, and total tooling cost. If adoption has already happened, use a period or a set of teams where adoption was minimal as the reference point. Without a baseline, you can't separate what the AI tools changed from what changed because of process, staffing, or infrastructure work in the same period.
2. Measure adoption at the team level
Adoption is usually uneven across teams, so an org-wide average hides the signal. Track which teams use AI coding tools, how many active seats each has, and how heavily those seats get used. Otherwise early adopters, partial adopters, and non-adopters blur into one population whose outcomes differ for reasons that have nothing to do with the tools.
3. Compare comparable teams and work
A team working on a mature monolith and a team building a new greenfield service will have different cycle times regardless of what tools they use. Before attributing any change in delivery or reliability metrics to AI, match higher-adoption and lower-adoption teams by codebase, technology stack, team seniority, and workload type. Stanford research cited in the DORA report found AI delivers a 35% to 40% productivity gain on simple greenfield tasks and often 10% or less on complex legacy codebases. Compare unlike work and you'll inflate or deflate the apparent impact, depending on which teams adopted first. Correlation between higher adoption and better outcomes does not by itself prove causation, since higher-performing teams may also be the earliest adopters.
4. Track delivery and risk together
In DORA's sample calculation for a 500-engineer organization at a fully loaded $176,000 per head, a one-percentage-point rise in change failure rate, from 5% to 6%, cost about $344,000 in downtime. Put each team's delivery metrics next to its reliability, security, and quality signals, because a delivery gain that comes with worse reliability or security can be a net loss.
5. Review on a recurring cadence
DORA's ROI report describes a J-curve: an early productivity dip from the learning curve, the "verification tax" of reviewing AI-generated code, and downstream processes like testing and change approval that haven't adapted to higher code volume. A single snapshot will likely catch you somewhere on that curve. Run the analysis monthly or quarterly and trend it over several cycles, so you can tell a learning-curve dip from a persistent quality problem. Put someone in the review with the authority to expand, adjust, or pull back the AI investment.
6. Act on what the data shows
End every review with tracked work items, each with an owner. If incident rates are climbing on teams with high AI adoption, open an initiative for test coverage, code review, or security scanning on AI-generated output. Delivery gains with steady reliability and security are evidence for expanding the investment.
How the DRIVE framework organizes these outcomes
The six-step process above is vendor-neutral by design, and it can be run with manual data pulls from whatever tools an organization already has. However, the recurring nature of the analysis creates an operational question: who owns the review, where does the data come from on a repeatable basis, and how do the findings get connected to actual work? The DRIVE framework, authored by Cortex CTO Ganesh Datta, provides a structure for answering those questions.
DRIVE organizes engineering health into five pillars, each of which answers a specific leadership question: Delivery (are we shipping fast, and is it sustainable?), Reliability (are we delivering on our promises to customers?), Initiatives (are our org-wide engineering investments making progress?), Vigilance (are we actively defending our systems and managing acceptable risk?), and Efficiency (are we allocating resources to the right problems?). The pillars are reviewed together at a recurring Operational Excellence (OpEx) review rather than in isolation, and DRIVE builds on familiar delivery metrics including the DORA signals while adding the organizational dimensions that DORA was not designed to cover. Cortex has run versions of the OpEx review on early drafts of DRIVE for more than three years, and over that period it more than doubled its PR volume while cutting incidents by 80%.
Delivery and Efficiency weigh gains against cost
If a team's deploy frequency doubles while its token bill triples, someone needs to check that the extra deploys are worth the extra spend. DRIVE makes that check routine by reviewing two pillars together: Delivery, which tracks deploy frequency, lead time for changes, and on-call pager volume, and Efficiency, which tracks cloud spend against budget and AI/LLM token costs.
When the OpEx review shows incidents climbing on high-adoption teams, the fix, such as a test-coverage push for AI-generated code, becomes an Initiative with an owner and a deadline.
Reliability and Vigilance as backpressure
Reliability starts from the customer's experience, with functional SLO pass/fail status and Sev0/Sev1 incident count as its critical metrics and change failure rate and MTTR as secondary signals. Vigilance asks whether security and compliance risk is piling up faster than teams retire it, tracking open critical and high fixable CVEs, assets that miss minimum compliance controls, and orphaned assets. At the OpEx review, these two pillars discount every delivery gain by what it did to incidents, SLOs, and open vulnerabilities. Without that backpressure, an improving lead time can't tell you whether the AI investment is paying off.
How Cortex AI Impact runs the measurement
The measurement process and the DRIVE framework describe what to measure and how to organize the review. The operational challenge for most organizations is that the data lives across multiple systems, including version control, CI/CD, incident management, observability, and security scanning, and pulling it together manually on a recurring basis is the fastest way to kill a review program. As the DRIVE paper notes, the moment the expectation to pull data falls on engineering managers or staff engineers, the OpEx review turns into an expensive status update and will die.
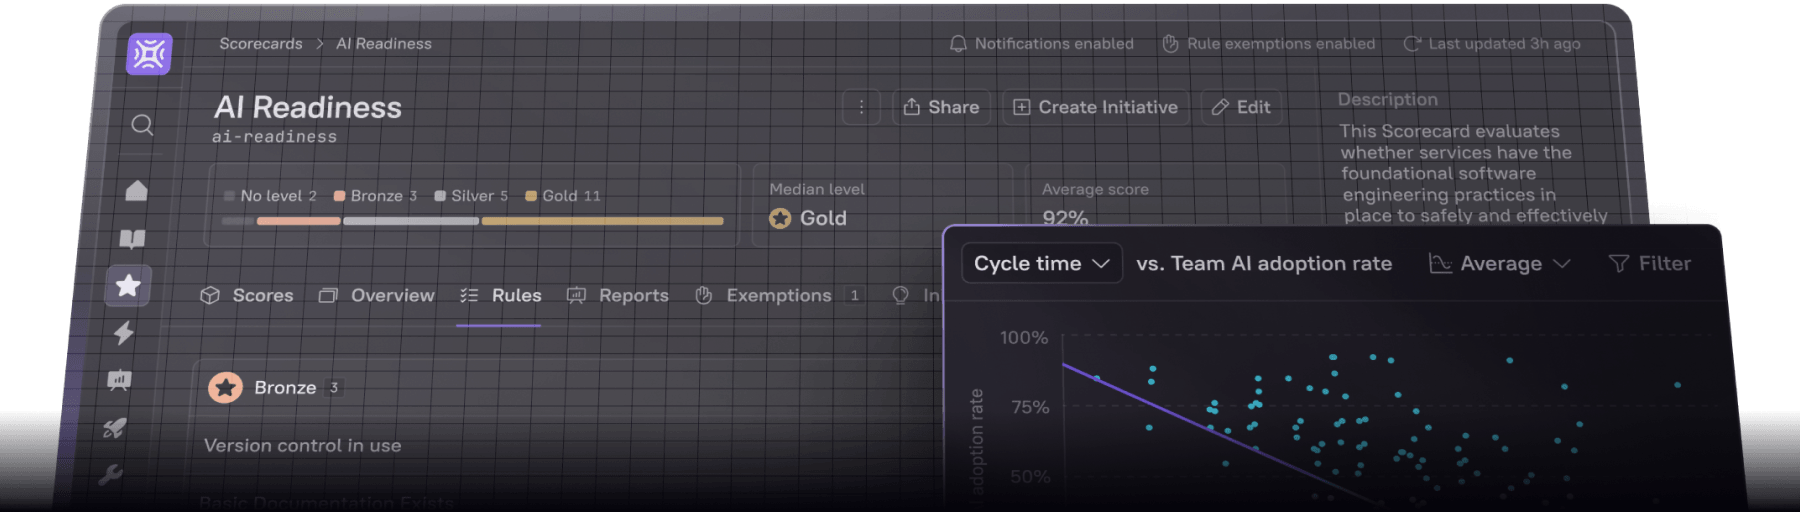
Cortex AI Impact report, part of Cortex's engineering operations platform, connects AI coding assistant usage to engineering outcomes by pulling data from those systems into a single view. It tracks adoption rate by team and puts delivery metrics like cycle time, deployment frequency, and MTTR alongside reliability and security signals, so that leadership can compare outcomes across teams with different levels of AI adoption. If incident counts or change failure rates are climbing on teams with high adoption, that shows up next to the delivery numbers rather than in a separate report.
The OpEx Review Agent takes that data pull off engineering managers. On a schedule you set, it reads across tools like GitHub and Datadog, plus SLO and incident data, then delivers a briefing before the meeting on what changed, what's at risk, and where to look first. It tracks AI cost and downstream risk next to delivery and reliability metrics, so the ROI comparison is part of every review. During the meeting, Cortex AI answers questions like why a metric moved and links each answer to its source. Follow-ups become owned items with linked tickets, and they carry into the next review until someone closes them.
The DRIVE framework and the OpEx review provide the governance layer. Scorecards set the standards that AI-assisted work needs to meet, such as test coverage thresholds, security scan requirements, and on-call rotation coverage. Initiatives track whether teams are making progress toward those standards, and the OpEx review creates the recurring cadence where leadership reviews the DRIVE metrics together and assigns owners to address what the data shows. Cortex does not replace AI coding assistants like Copilot or Cursor. It provides the measurement and governance infrastructure that tells you whether those tools are improving engineering outcomes without compromising reliability or security.
See how Cortex AI Impact measures the ROI of your AI coding assistants: book a demo.
FAQs
What's a realistic timeframe to see ROI from AI coding assistants?
In DORA's sample model of a 500-engineer organization, AI tooling paid for itself in about eight months. Expect a J-curve on the way, with an early productivity dip before gains appear. Gains also stay small on high-complexity brownfield work, where Stanford research found improvements of 0% to 10%. Your own payback period depends on how quickly review and testing processes adapt to the higher volume of AI-assisted output, so trend your metrics across several review cycles to tell a temporary dip from a persistent problem.
Should we measure ROI at the individual developer level?
No. Individual metrics are easy to game, since a developer who knows their acceptance rate is tracked will optimize for that number. They're also noisy, because one person's output depends on the type of work, the codebase, and the team's review process. DORA and the DRIVE framework both measure at the team and organizational level for this reason. Ask whether teams with higher AI adoption are delivering better engineering outcomes at a sustainable cost.
Do DORA metrics measure AI coding assistant ROI on their own?
DORA's five software delivery metrics (change lead time, deployment frequency, failed deployment recovery time, change fail rate, and deployment rework rate) are one input to the ROI model. They show whether delivery health is improving, and they carry no cost data. License spend, token costs, governance overhead, vulnerability backlogs, and orphaned assets all sit outside them. DRIVE folds the DORA metrics into its Delivery and Reliability pillars and adds Efficiency and Vigilance to cover cost and security risk.
How do token and usage costs change the ROI calculation?
With consumption-based pricing, AI coding tool costs scale with usage, so the cost side of the ROI calculation keeps moving. Gartner forecasts that spending on AI coding agents will surpass the average developer salary by 2028. Track token and API spend at the team level, next to delivery and reliability metrics, so you can compare each team's delivery gain against what it cost to produce.
What do we do if the data shows negative ROI?
Investigate before you cancel anything. First, figure out if you're looking at an early J-curve dip or a pattern that persists across several review cycles. If delivery is flat or falling while costs and risk indicators rise for multiple cycles, the finding is real. Your options then are to scale back adoption, invest in code review and testing infrastructure, or point the tools at the work where they help most, such as greenfield services. When you take the numbers to finance, use DORA's approach of modeling conservative, realistic, and optimistic scenarios.