
This is the fifth and final post in the DRIVE Deep Dive series, following Delivery, Reliability, Initiatives, and Vigilance. For the complete model across all five pillars, download the full DRIVE framework.
--
Engineering money and time land in three places a leadership review can actually act on: the cloud bill, the internal spend on AI and LLM tokens, and the split between building new things and keeping old ones running. Most organizations review the first once a quarter, in front of a finance audience. They review the second almost never. They guess at the third.
Eighteen months ago, internal token spend barely existed as a budget category. Today, FinOps teams managing some form of AI spend have gone from 31% to 98% of practitioners in about two years, scrambling to govern a cost line that didn't show up on finance's radar a year and a half ago. Uber handed coding-agent access to 5,000 engineers in December and had burned its entire annual AI budget by April. Unlike headcount or a data-center contract, token spend has almost no natural friction slowing it down, and it stays invisible until it hits a ceiling deep into an AI rollout.
It would be easy to read a pillar called Efficiency as where leadership hunts for cuts. It’s the wrong instinct; spending the right amount on the right things is a different discipline from spending less. In DRIVE, the Efficiency pillar asks:
Are we allocating resources to the right problems?
What Efficiency measures
Efficiency consists of three critical metrics.
Cloud spend vs. budget: measures whether infrastructure cost is tracking the plan, and where it's drifting if not.
AI/LLM token costs: measures the newest and least governed line, internal agent spend, not customer-facing.
Percentage of capacity on innovation: measures the split between new feature work and KTLO, the maintenance and operational upkeep that keeps existing systems running.
Cloud spend vs. budget
Actual cloud spend against budget, tracked by category (compute, storage, logging, observability) and rolled up so every level, team, domain, org, sees its own variance in both dollars and percent, not just the blended number.
Take a Platform domain that closes Q3 at exactly 100% of budget. Clean green headline, nothing to discuss. Underneath that number, compute ran 25% under budget and logging ran 75% over. The two variances cancel each other out, which is exactly why the “total” row can't be the only thing a leadership review sees.
Once logging shows up as its own line running 75% over, the OpEx review has a real question to ask: why is logging growing that much faster than everything around it, and what's producing the volume? The framework's default red signal is more than 5% over budget at the category level, a starting point for tuning to the organization’s environment.
For an early-stage org without firm budgets yet, the metric is still relevant as anomaly detection: a category suddenly moving is worth a question even without a target to measure it against.
Note: Cloud spend is often treated as a FinOps responsibility rather than an engineering one. For many orgs that's true, and a dedicated FinOps team owning cost visibility is a strong starting position. The discipline has grown well past its origins, enough that the FinOps Foundation itself renamed its mission from managing the value of cloud to managing the value of technology. DRIVE moves cloud spend from a quarterly finance review into the weekly engineering leadership review, next to delivery and reliability, so the people making daily infrastructure calls see the cost consequences in the same week they're made. Even so, none of this replaces a FinOps practice.
AI/LLM token costs
A team spending nothing on internal tokens may look disciplined on a spreadsheet. That's actually a red flag. Enterprise LLM API spend passed $8.4 billion in 2025 and is on track to double again this year, even as the price of a single token keeps falling, because volume is outrunning every budget model built to contain it. Against that backdrop, a team at zero internal token spend isn't frugal. It's most likely not running agents against its own work at all, leaving leverage on the table.
The metric works the same way as cloud spend: sum actual token spend, sum budget, surface the variance, kept in a separate bucket from customer-facing product LLM costs, which are a different accounting conversation entirely. What's different is the red signal, which fires in two directions. Over budget against allocation is the familiar failure mode. Sitting at or near zero is the other. McKinsey's own research shows the same gap: 88% of organizations report regular AI use somewhere in the business, but only about a third say they've actually begun scaling it, which means minimal token spend is far more likely to mean "adopted in name only" than "spending carefully." The rule is right cost, not lowest cost.
Percentage of capacity on innovation
Add the teams' raw numbers together first, then divide, instead of averaging their percentages. A domain reports 70% of capacity on innovation this quarter, the blended average of one team running at 90% and another running at 10%. The 90% team is shipping. The 10% team is underwater on KTLO, and has been for months. Averaged together, the domain clears the bar and the review moves on. The team that needed help never gets the necessary focus.
Few orgs have a clean number for hours spent on each. Here are potential proxies: what fraction of pull requests aren't labeled maintenance, how many feature tickets get filed against bug tickets, or ask engineers to report themselves at the end of a sprint. None of these are precise; the goal is direction, a rough read on where the split sits, not a decimal.
Healthy orgs tend to land around 15 to 30% of capacity on KTLO. The number worth watching for in an OpEx review is less about clearing that band and more about the gap between what leadership assumed the split was and what the first honest measurement shows. That first real number almost always lands lower than the hypothesis. The red signal itself is two-part: set a fixed threshold, and measure how far the current split has moved from that team's own rolling average, since a sudden swing matters even inside the healthy band. If no workable proxy exists yet for a given team, leave this metric off the leadership view rather than ship one that's probably wrong.
Why Efficiency gets gamed, and how DRIVE catches it
Efficiency is the easiest pillar in DRIVE to game. Costs shuffle between categories, and KTLO quietly disappears from the split because no team wants to report that it spends 40% of its time keeping the lights on.
Google's own 2025 DORA research, drawn from nearly 5,000 technology professionals worldwide, confirms the same pattern industry-wide: AI adoption now shows a positive relationship with delivery throughput, but a negative relationship with delivery stability. That’s why DRIVE is coupled with the OpEx review; metrics are meant to be read together instead of five disparate scorecards. A team can relabel its own work, but it can't relabel its way out of stalled initiatives and climbing incidents.
Go back to that 90/10 domain. Averaged out, it still reads 70% clean and green. But say its Tier 1 initiatives have stalled for two cycles, and Sev0s are up 40% quarter over quarter. This is the situation DRIVE is built to catch: no single pillar is trusted alone, so a green Efficiency number sitting next to a red Initiatives and a red Reliability doesn't get dismissed as three unrelated problems. It gets read as one signal.
The secondary drag metrics
Once the critical metrics are stable, the following secondary metrics are useful as drill-downs in this pillar.
Human cost of incidents: Sum of MTTR for Sev0 and Sev1 incidents multiplied by the number of people involved. A Sev0 that takes six hours to resolve and pulls in twelve people costs far more than the outage itself once labor gets counted. This is often the most direct way to surface the hidden labor cost of unreliability to a leadership audience.
Infrastructure utilization rate: The percentage of provisioned capacity that is actually being used. Useful for surfacing over-provisioning that the headline cloud spend number can mask, especially in organizations that have moved from fixed capacity to autoscaling but have not revisited their reservations.
Surveyed enterprises put the average annual bill for unplanned downtime near $300 million, with a single major incident dropping stock price by an average of 3.4%.
Reading Efficiency in the OpEx review
Leaders in the Operational Excellence review use these signals to decide where to reallocate. Teams should monitor whether cloud variance is hiding inside a clean total row, whether token spend is over allocation or sitting at zero, and whether the measured innovation split matches what leadership assumed. Because Efficiency is easiest to game, reviewers should never read it alone, but rather in comparison with Reliability and Initiatives.
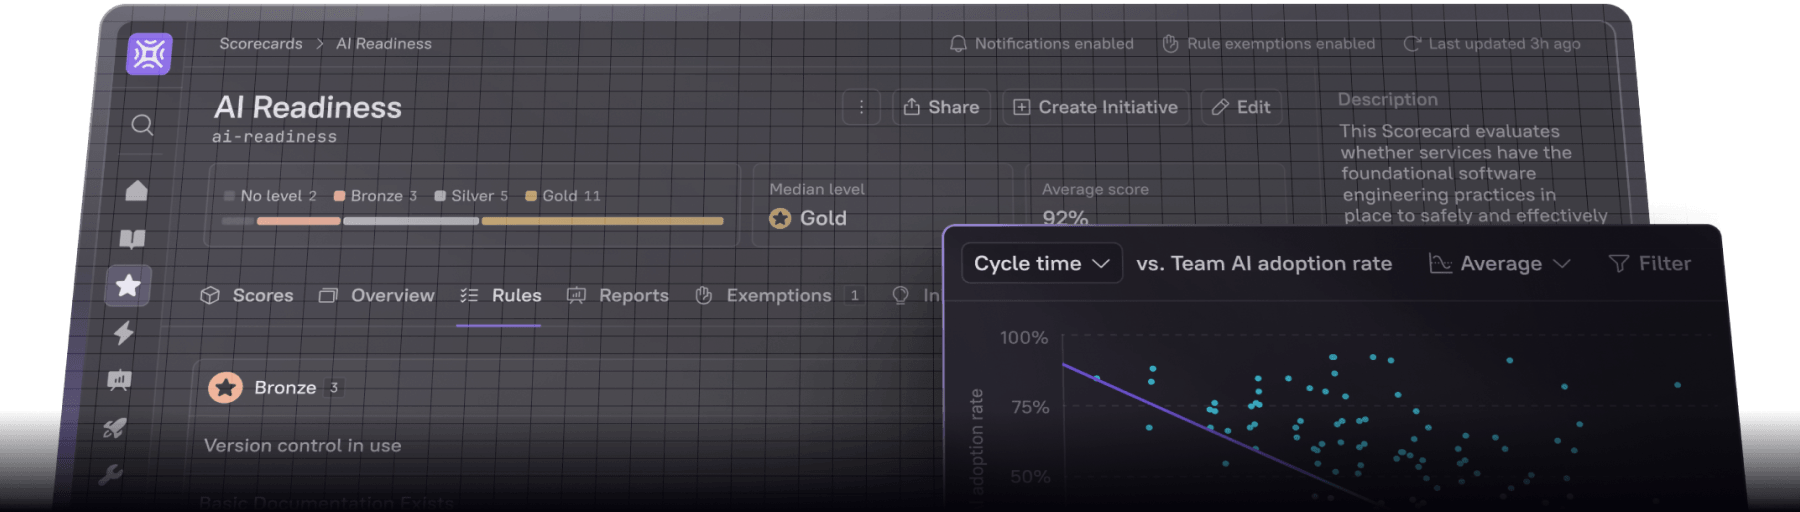
These signals itself may be scattered across various platforms: cloud variance lives in billing, token spend lives in agent and LLM tooling, and the capacity split has to be inferred from ticketing and PR systems. Cortex allows teams to pull these data points into one view, and Eng Intelligence insights like the AI Impact Dashboard ties AI tool usage to cycle time, deploy frequency, MTTR, and change failure rate.
This concludes the DRIVE Deep Dive series. We've covered five pillars, ultimately meant to answer: can this organization sustainably turn customer needs into working software while holding speed, quality, and cost in balance? Take the DRIVE maturity assessment to see where your organization stands, or download the full DRIVE framework for the complete model.